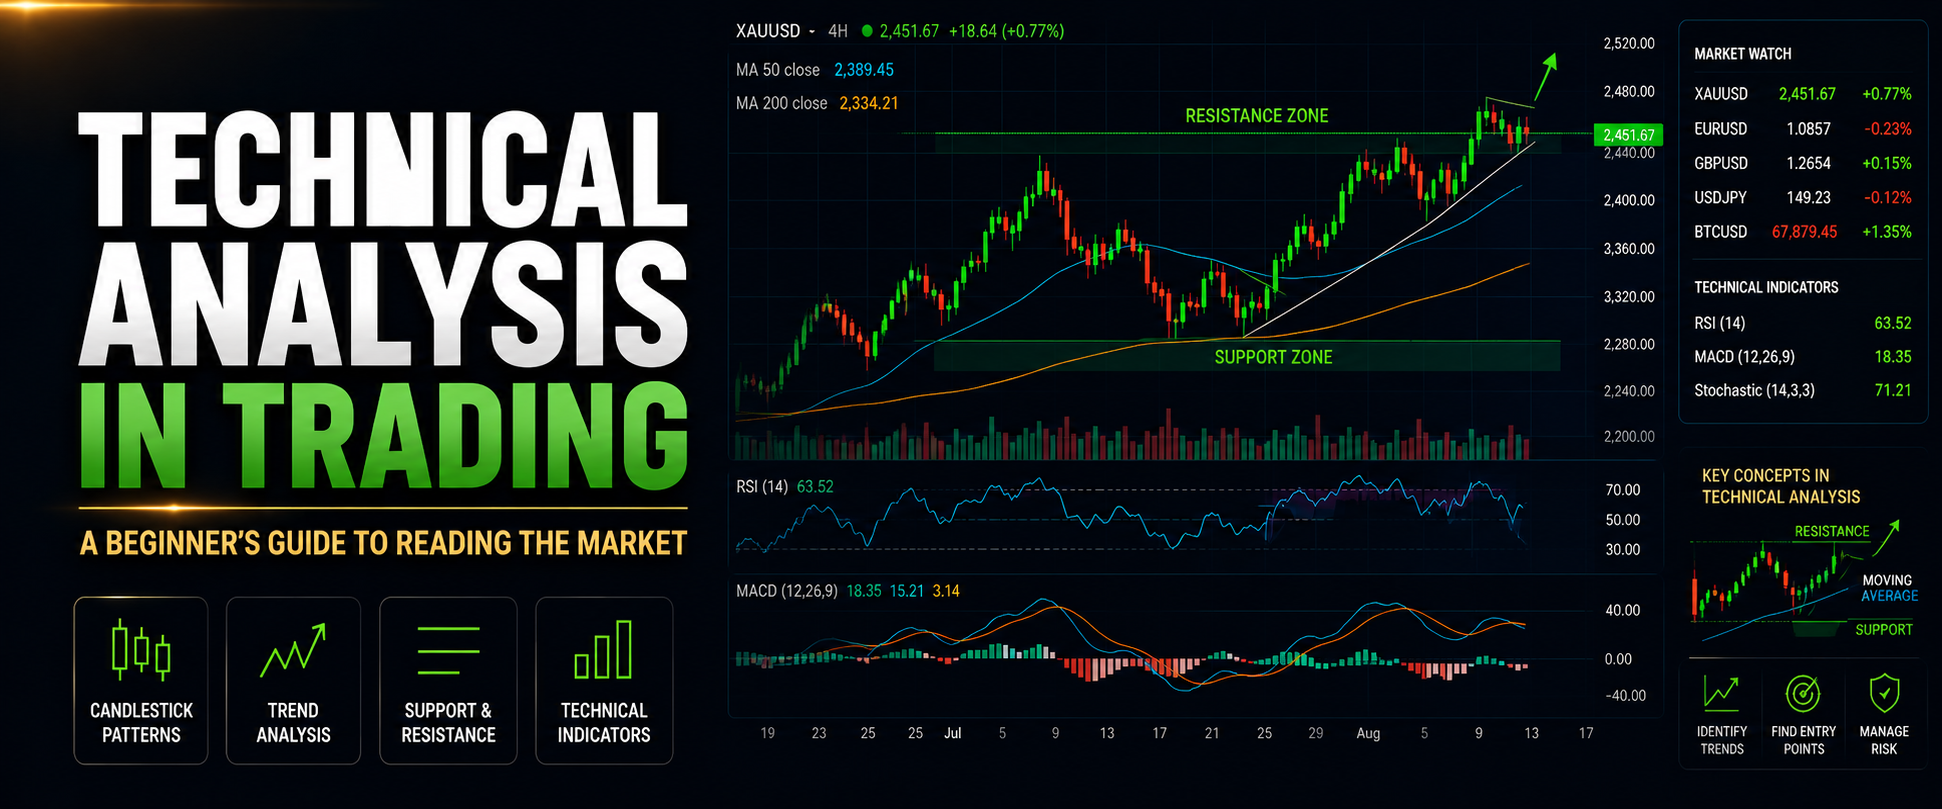
What if a chart could help you understand where a market may go next?
That is the basic idea behind technical analysis in trading.
Technical analysis helps traders study price charts and past market activity. It can help you spot trends, possible entry points, and areas where prices may change direction.
This beginner-friendly update is covered in more depth on Daily Duniya, your home for daily market updates, trading education, and financial news.
What Is Technical Analysis in Trading?
Technical analysis is a way to study price movement. Traders look at charts instead of only reading company news or economic reports.
The main idea is simple: price can show important clues about market behavior.
Traders study things like:
- Price movement
- Trading volume
- Market trends
- Support and resistance
- Chart patterns
For example, if a stock keeps making higher prices, it may show an upward trend. A trader can use this information to plan a trade.
How Do Trading Charts Work?
Charts show how the price of an asset moves over time. You may see lines, bars, or candles on a chart.
A candlestick shows how the price moved during a certain time. It can show the opening price, closing price, highest price, and lowest price.
You do not need to understand every chart tool at the start. Begin with simple price action and learn one concept at a time.
This makes market analysis easier and less confusing.
Understanding Market Trends
A trend shows the general direction of the market.
There are three common types:
Uptrend: Prices are generally moving higher.
Downtrend: Prices are generally moving lower.
Sideways trend: Prices move within a range without a clear direction.
Understanding trends is one of the first skills a new trader should learn.
You can also look for support and resistance. Support is a price area where buying may become stronger. Resistance is an area where selling may become stronger.
These levels can help you understand where price may slow down or change direction.
Popular Technical Analysis Tools
Technical analysis has many tools. But beginners do not need to use all of them.
Some popular tools include:
- Moving Average: Shows the average price over a period.
- RSI: Helps show whether price may have moved too far up or down.
- Trendlines: Help show the direction of price.
- Volume: Shows how much trading activity is happening.
- Support and Resistance: Help identify important price areas.
These tools are not magic signals. They can sometimes give false signals.
That is why you should never depend on one indicator alone.
Technical Analysis and Trading Risk Management
Good analysis is only one part of trading. Trading risk management is just as important.
Even a strong-looking chart can be wrong. Markets can move quickly because of news, economic events, or unexpected changes.
This is why traders use different risk management strategies.
For example:
- Never risk money you cannot afford to lose.
- Use a stop-loss when suitable.
- Avoid putting all your money into one trade.
- Keep your trade size under control.
- Have a clear plan before entering a trade.
Managing trading risk helps protect your account when a trade does not go as planned.
A good trader does not only ask, “How much can I make?” They also ask, “How much can I lose?”
Follow Daily Market Insights
Learning technical analysis takes time. You do not need to become an expert in one day.
Keep watching charts and learn from both winning and losing trades. Follow market trends, stock updates, trading news, and simple market analysis to improve your knowledge.
For quick market tips, charts, and daily highlights, Bull & Bear Whispers follow our Instagram page and stay connected with Daily Duniya.
Remember, technical analysis is a tool. It does not guarantee profits. Your decisions should always include proper research and risk control.
Start Learning Before You Start Trading
Technical analysis in trading can make charts easier to understand. It helps you study price behavior and look for possible trading opportunities.
But no strategy works every time. The market can always surprise you.
Start small. Learn the basics. Control your risk. Most importantly, build discipline before chasing profits.
Want exclusive updates, real-time alerts, and more trading content like this? Join our Bull & Bear Whispers WhatsApp channel and stay connected with Daily Duniya.