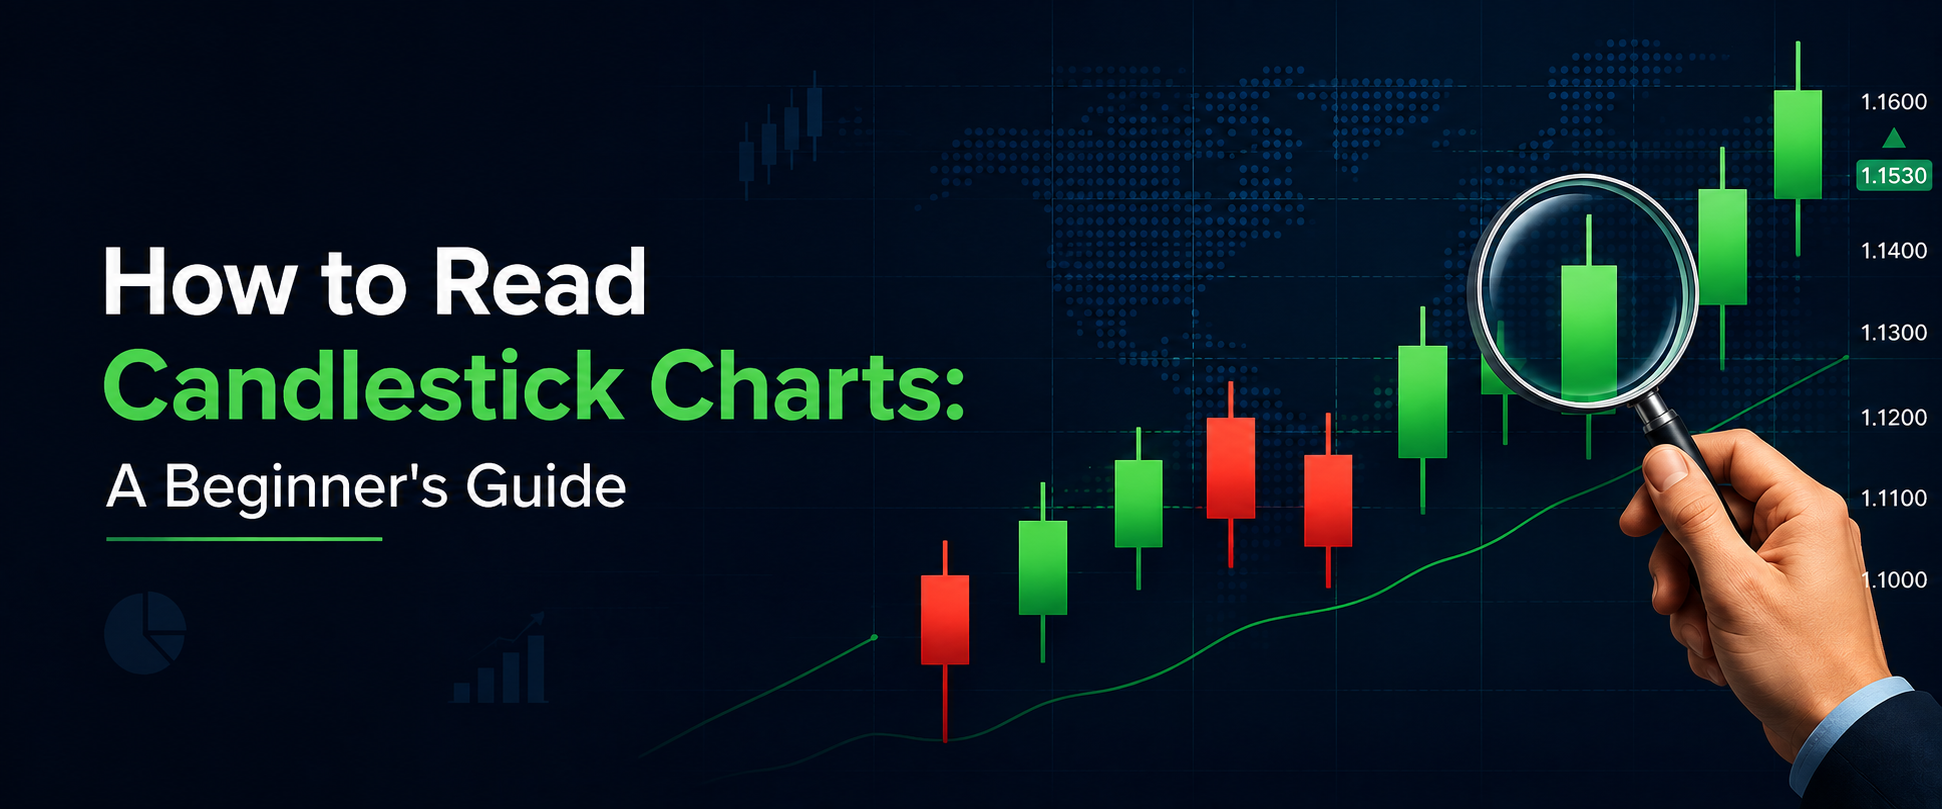
Did you know that a single candlestick can tell you a whole story about a stock’s battle between buyers and sellers? Once you know how to read candlestick charts, price charts stop looking like random lines and start making real sense.
If you’re new to trading, candlestick charts might look confusing at first. Small colored bars, wicks sticking out on top and bottom, different shapes everywhere. But once you understand the basics, you’ll wonder how you ever looked at a chart without them.
At Daily Duniya, we break down trading and market concepts in simple language so you can learn at your own pace. This guide will teach you everything you need to know about candlestick charts, from the basics to common patterns beginners should know.
What Is a Candlestick Chart?
A candlestick chart is a way to show how a stock’s price moved during a specific time period. Each “candle” represents one unit of time. This could be one minute, one hour, one day, or even one week, depending on the chart you’re using.
Traders love candlestick charts because they pack a lot of information into one small shape. Instead of just seeing where a price ended up, you can see how it got there.
Each candle has two main parts:
- The body – the thick, rectangular part in the middle
- The wicks (or shadows) – the thin lines above and below the body
Together, these parts show you four important price points for that time period. We’ll cover those next.
How to Read Candlestick Charts
Now let’s get into the actual process of how to read candlestick charts. This is simpler than it looks once you break it down.
Every single candle shows you four things:
- Open – the price when the time period started
- High – the highest price reached during that period
- Low – the lowest price reached during that period
- Close – the price when the time period ended
The body of the candle stretches between the open and close prices. The wicks show the high and low. If you understand this one idea, you already understand the foundation of candlestick reading.
Color is the next clue. Most charts use two colors, usually green and red (though some use black and white or blue and orange). The color instantly tells you whether the price went up or down during that period, without you needing to check the exact numbers.
What Open, High, Low and Close Mean
Let’s slow down and look at open, high, low, and close (often shortened to OHLC) a little more closely, since these four values are the building blocks of every candle.
- Open: This is simply the first traded price when that time period began. On a daily chart, this would be the price right when the market opened for the day.
- Close: This is the final traded price when the time period ended. On a daily chart, this is the price when the market closed.
- High: This is the highest price the stock touched at any point during that period, even briefly.
- Low: This is the lowest price the stock touched during that period.
Think of it like tracking a cricket team’s score through an innings. The open is the score when play started, the close is the score when play ended, and the high and low show the best and worst moments in between.
If you want a deeper foundation before moving further, our guide on what is technical analysis in trading explains how these price patterns fit into the bigger picture of chart reading.
Bullish and Bearish Candles
Once you know the four price points, the next step is understanding candle colors. This is where the terms “bullish” and “bearish” come in.
A bullish candle forms when the closing price is higher than the opening price. This means buyers were in control during that period, pushing the price up. Bullish candles are usually shown in green or white.
A bearish candle forms when the closing price is lower than the opening price. This means sellers had control, pushing the price down. Bearish candles are usually shown in red or black.
Here’s a simple way to remember it:
- Bullish = price went up = green
- Bearish = price went down = red
The size of the body also matters. A long body means there was a strong move in that direction. A small body means the price didn’t move much, and buyers and sellers were more evenly matched.
Common Candlestick Patterns for Beginners
Once you’re comfortable reading single candles, you can start looking at candlestick patterns. These are specific arrangements of one or more candles that traders watch for, because they can hint at possible price direction.
Here are a few simple patterns worth knowing:
- Doji: The open and close prices are almost the same, creating a tiny or non-existent body with wicks on either side. This often signals indecision in the market.
- Hammer: A small body near the top of the candle with a long lower wick. This can appear after a downtrend and may hint at a possible reversal.
- Shooting Star: The opposite of a hammer. A small body near the bottom with a long upper wick, sometimes appearing after an uptrend.
- Engulfing Pattern: This uses two candles, where the second candle’s body completely “engulfs” the first one. A bullish engulfing pattern can suggest buyers are stepping in strongly.
Quick tip: Follow Bull & Bear Whispers on Instagram, where we regularly share easy visual breakdowns of these patterns along with quick trading tips and market highlights you can scroll through in seconds.
It’s important to remember that no single pattern guarantees what will happen next. Patterns are tools that give clues, not certainties.
How Traders Use Candlestick Analysis
So why do traders bother with all of this? Candlestick analysis helps traders understand market mood, or what is often called market sentiment.
By looking at candle shapes, colors, and patterns over time, traders try to answer questions like:
- Are buyers or sellers currently in control?
- Is the current trend showing signs of slowing down?
- Does this look like a good point to watch closely before entering or exiting a position?
Many traders don’t use candlestick charts alone. They often combine candlestick analysis with other tools, like support and resistance levels, trend lines, or indicators, to build a fuller picture. If you’d like to understand this bigger toolkit, our article on technical trading explained is a good next step.
It’s also worth noting that candlestick reading is a skill that improves with practice. The more charts you look at, the easier it becomes to notice patterns and shifts in sentiment.
Common Mistakes Beginners Should Avoid
As you start practicing how to read candlestick charts, it helps to know the common traps beginners fall into.
- Relying on a single candle: One candle rarely tells the full story. Always look at the surrounding candles and overall trend before drawing conclusions.
- Ignoring the time frame: A pattern on a 5-minute chart means something different than the same pattern on a weekly chart. Always keep the time frame in mind.
- Treating patterns as guarantees: Candlestick patterns show probabilities and tendencies, not certainties. Prices can and do move against expectations.
- Skipping the basics: Jumping straight into complex patterns without understanding open, high, low, and close first often leads to confusion later.
- Not learning the fundamentals of trading first: Candlestick charts are just one part of trading. If you’re still building your foundation, our guide on what is trading is a helpful starting point.
Take your time with each concept. Understanding candlestick charts is a gradual process, not something you master in a day.
Final Thoughts
Learning how to read candlestick charts is one of the most useful skills you can build as a beginner trader. Once you understand open, high, low, close, and basic patterns, you’ll start seeing charts in a completely new way.
Remember, this guide is meant to help you build knowledge, not to predict the market or promise results. Trading always involves risk, and no chart pattern can guarantee an outcome. Keep learning, practice patiently, and always do your own research before making any decisions.
For more beginner-friendly guides on trading, technical analysis, and market basics, explore more articles on the Daily Duniya website, your home for daily market updates and financial content.
Want real-time market alerts and exclusive updates delivered straight to your phone? Join the Bull & Bear Whispers WhatsApp channel today and get direct access to more trading and financial content, so you never miss an update.