Have you ever watched a stock price bounce off the same point again and again, like it hit an invisible wall? That’s not luck. That’s support and resistance in trading, and once you understand it, charts will start to make a lot more sense.
At Daily Duniya, we break down trading and financial concepts in simple language for beginners. In this guide, you’ll learn what support and resistance levels are, why they matter, and how traders use them every day.
What Are Support and Resistance in Trading?
In simple words, support and resistance are price levels where a stock or asset tends to stop and change direction.
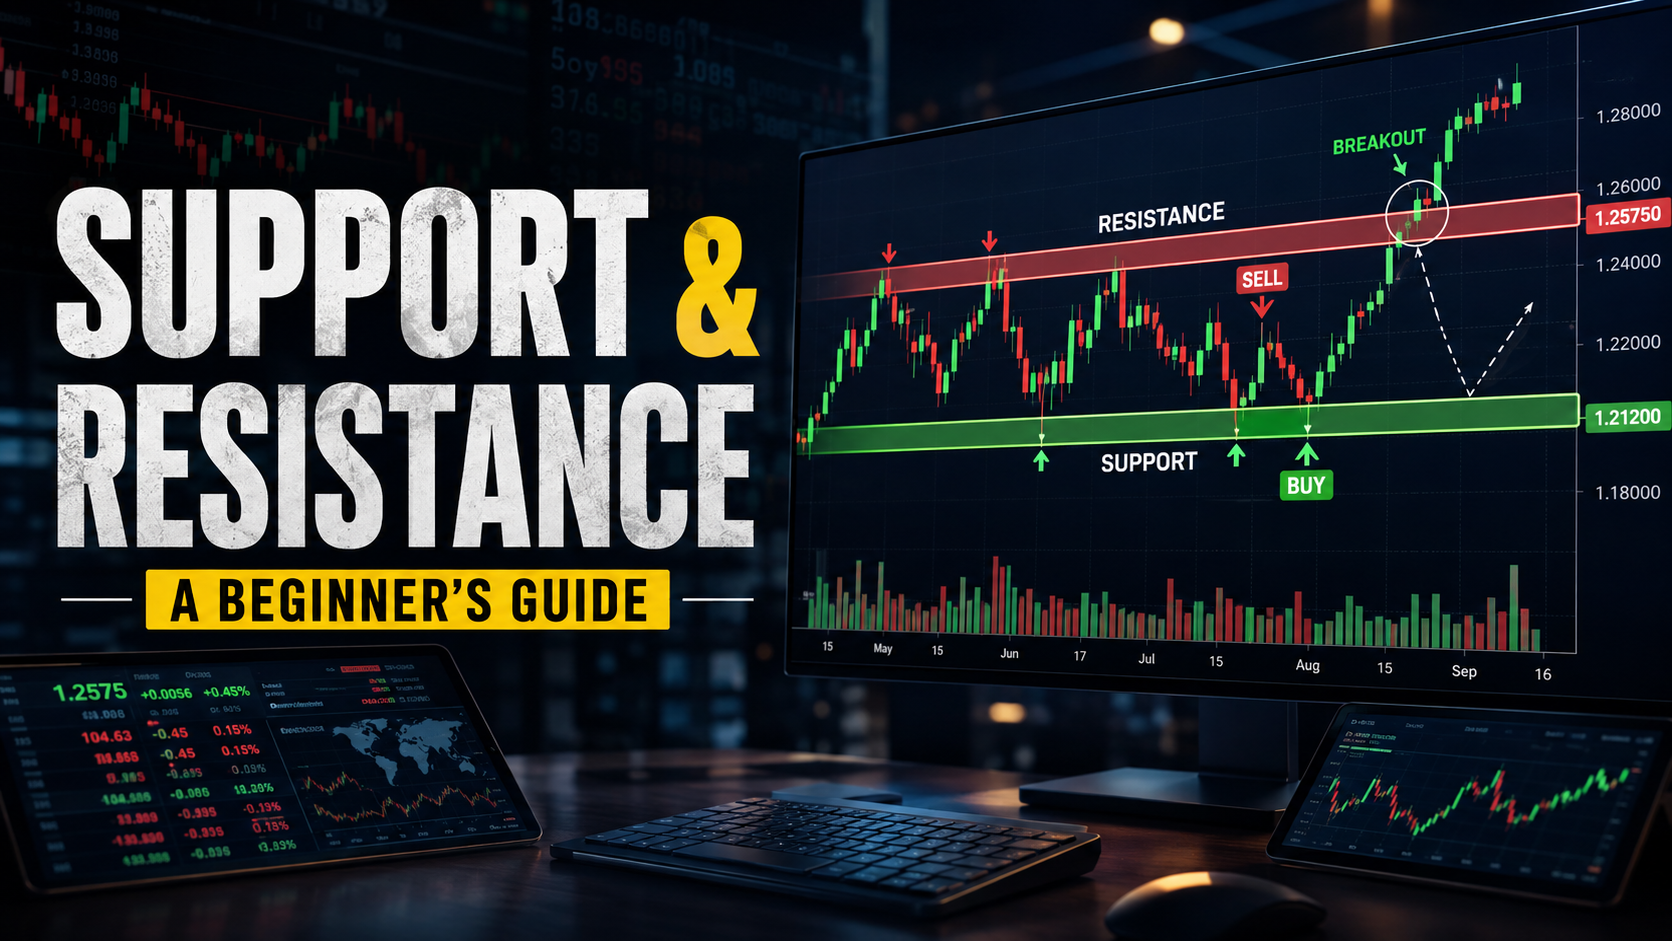
Support is a price level where the price usually stops falling. Think of it as a floor. When the price drops to this level, buyers often step in, and the price bounces back up.
Resistance is the opposite. It’s a price level where the price usually stops rising. Think of it as a ceiling. When the price reaches this level, sellers often step in, and the price falls back down.
These two ideas form the base of support resistance trading. Almost every trader, from beginners to professionals, uses them in some way.
How Support Levels Work
Support levels work because of simple human behavior: buying and selling.
When a price falls to a certain level, more people believe it’s “cheap” and start buying. This buying pressure slows down the fall and can push the price back up.
Here’s a simple example:
- A stock keeps falling and stops around Rs. 100 three different times.
- Each time, the price bounces back up from Rs. 100.
- This Rs. 100 level becomes a support level.
Support levels are not exact. They act more like a zone than a single line. The price may dip slightly below or above this zone before reacting.
It’s also worth knowing that support isn’t permanent. If enough sellers push through it, the price can break below and fall further. When this happens, traders say the support level has been “broken.”
How Resistance Levels Work
Resistance levels work in the opposite way. They happen because of selling pressure.
When a price rises to a certain level, more people feel it’s “expensive” and start selling. This selling pressure slows down the rise and can push the price back down.
For example:
- A stock keeps rising and stops around Rs. 150 three different times.
- Each time, the price falls back down from Rs. 150.
- This Rs. 150 level becomes a resistance level.
Just like support, resistance is also more of a zone than one exact number. And resistance can break too. If enough buyers push through it, the price can rise above the old ceiling and continue climbing. Once broken, that resistance level often turns into a new support level. This flip is one of the more interesting parts of support and resistance explained through real price movement.
How Traders Identify Support and Resistance Levels
You don’t need special tools to spot these levels. You mainly need a price chart and a bit of practice. Here’s how traders usually do it:
- Look for repeated price points. If a price touches the same area two or three times without breaking through, that area is likely support or resistance.
- Use round numbers. Prices often react around round numbers, like Rs. 100 or Rs. 500, because many traders place orders at these points.
- Check past highs and lows. Old price highs often act as resistance, and old lows often act as support, even months later.
- Use trendlines. By connecting a series of highs or lows with a line, traders can spot support and resistance that moves along with the trend, not just flat levels.
If you’re new to charts in general, our guide on how to read candlestick charts can help you understand price movement more clearly before you start marking these levels.
Support and Resistance in Technical Analysis
Support and resistance are two of the most basic building blocks of technical analysis.
Technical analysis simply means studying price charts and patterns to understand possible future price movement, instead of only looking at a company’s financial reports.
Traders combine support and resistance with other tools, such as:
- Moving averages, which smooth out price data over time.
- Volume, which shows how many shares or units were traded.
- Chart patterns, like triangles or head-and-shoulders shapes.
When these tools line up with a support or resistance level, traders often feel more confident about that level. This is why technical analysis support and resistance are usually taught together, not separately.
If this is your first time hearing about technical analysis, it may help to start with our beginner guide on what is technical analysis in trading. It explains the bigger picture, while this article focuses only on support and resistance.
By the way, if you enjoy quick, easy-to-digest trading tips, useful charts, and daily highlights, you can follow our Bull & Bear Whispers Instagram page. We regularly share simple visuals that make concepts like support and resistance easier to understand at a glance.
Common Mistakes Beginners Should Avoid
Learning support and resistance levels sounds simple, but beginners often make a few common mistakes. Here are the ones to watch out for:
- Treating levels as exact prices. Support and resistance are zones, not single numbers. Expecting the price to reverse at one exact point can lead to confusion.
- Ignoring broken levels. When a support or resistance level breaks, some beginners keep expecting the old behavior to repeat. Markets change, and levels can lose importance over time.
- Using too many levels at once. Marking every small bounce on a chart can make it messy and confusing. Focus on the strongest, most repeated levels.
- Relying only on support and resistance. These levels are helpful, but they work best when combined with other tools, like the ones covered in technical trading explained.
- Expecting guaranteed results. No level works every single time. Prices can break through support or resistance without warning, especially during sudden news events.
Avoiding these mistakes won’t guarantee success, but it will help you read charts with more clarity and less confusion.
How Beginners Can Use Support and Resistance
As a beginner, you don’t need to master every detail right away. Start small and build your understanding step by step.
Here are a few simple ways to begin:
- Practice spotting levels. Open a chart and try to mark support and resistance zones yourself, without using any tool. This builds your eye for patterns.
- Watch how price reacts. Instead of predicting, simply observe what happens when price reaches these levels over time.
- Combine with basics. Support and resistance work best alongside a solid understanding of trading basics. Our article on trading basics explained is a good starting point if you’re new to the market overall.
- Stay patient. Reading charts is a skill that improves with time and practice, not something you master overnight.
Remember, support and resistance are tools to help you understand price behavior. They are not guarantees, and no strategy removes risk completely. Always do your own research, and consider your own financial situation before making any trading decisions.
Final Thoughts
Support and resistance in trading may seem like a small concept, but it forms the foundation for reading any price chart. Once you start spotting these levels, you’ll notice them everywhere, from stocks to crypto to currencies.
Keep practicing, stay patient, and build your knowledge one step at a time.
Want more beginner-friendly trading guides, market updates, and financial content? Join the Bull & Bear Whispers WhatsApp channel today for exclusive updates, real-time alerts, and content made simple for you.