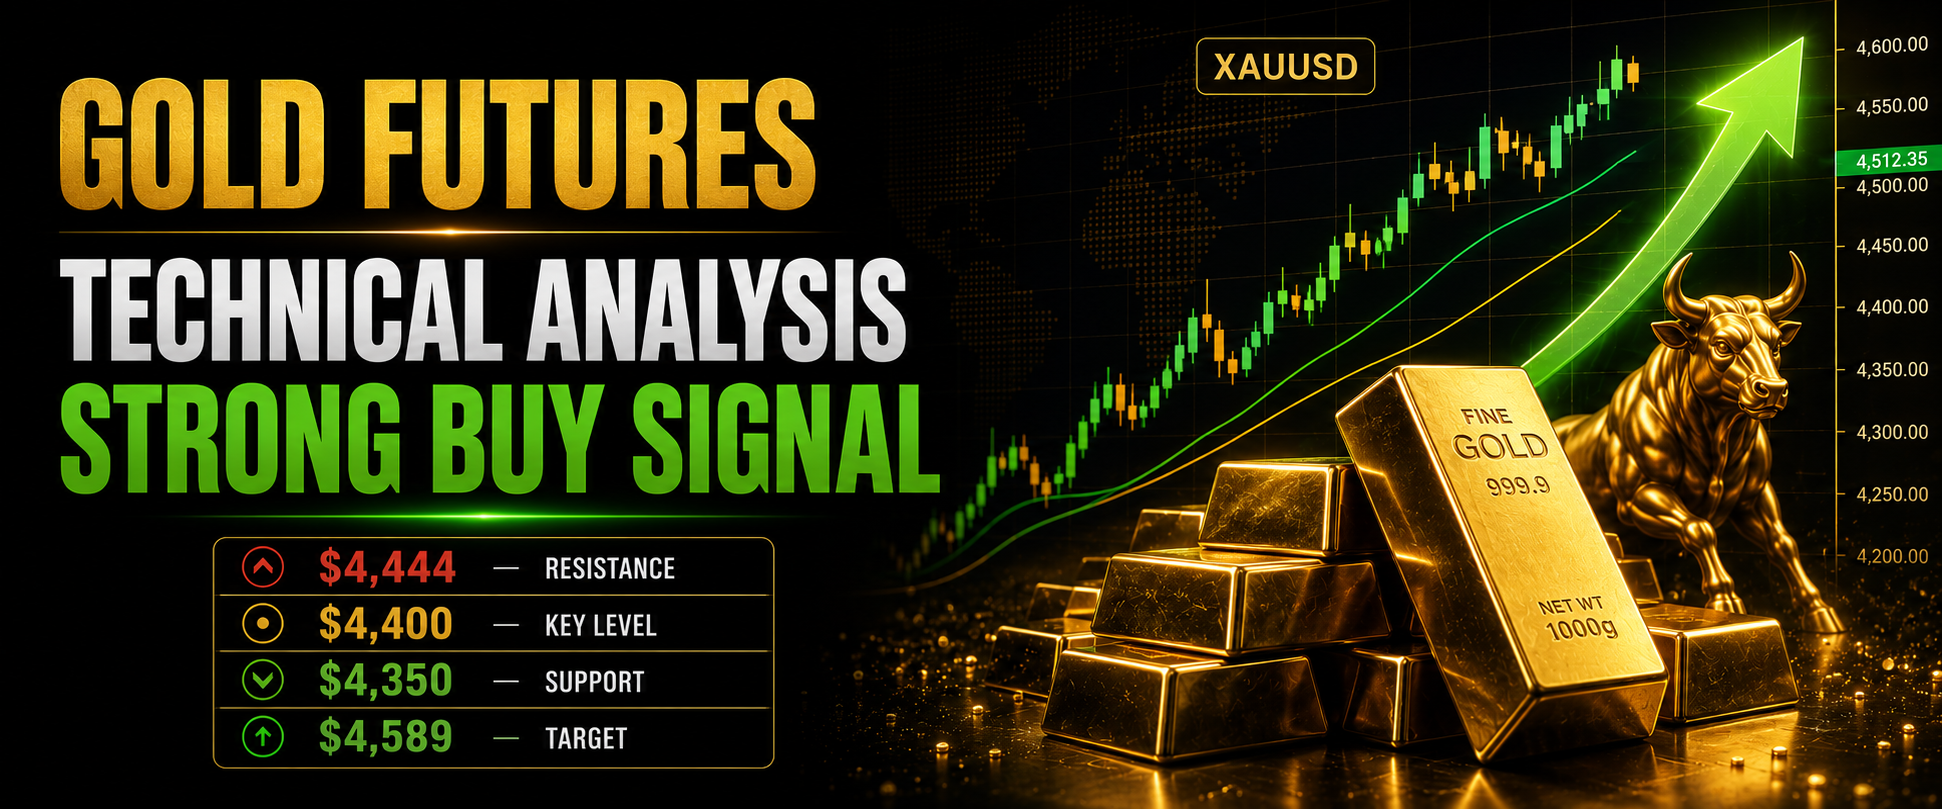
Gold is back near the $4,400 area, and buyers are showing fresh strength. Could this be the start of another big move higher?
Today’s Gold Futures Technical Analysis shows a bullish setup, but traders should still watch key price levels. Gold has found buyers near the $4,350 area and moved back above $4,400 in early trading.
This update is covered in more depth on Daily Duniya, your home for daily market updates, trading news, and simple market analysis.
Gold Futures Strong Buy Signal Today
The short-term picture is positive. Gold bounced from lower levels and buyers quickly pushed the price higher.
A Strong Buy signal means the current chart setup favors buyers more than sellers. It does not mean gold must rise every minute.
Key points to watch:
- $4,400: Important price area
- $4,350: Key short-term support
- $4,444: Important upside level
- $4,589: Possible next target if buyers break higher
Market reports also show gold trading around $4,400 as traders wait for the latest US inflation data.
Gold Technical Analysis Today: Key Levels
Price levels can help you understand where buyers and sellers may become active.
The $4,350 region is an important support zone. Support is simply a price area where buyers may step in and stop a fall.
On the upside, $4,444 is a key level. A strong move above this area could give bulls more confidence and open the door toward higher levels. One current market analysis points to $4,589 as a possible upside target after a confirmed break.
However, a failed breakout could bring gold back toward support.
Gold Market Outlook: What Could Move Price?
The next major driver is US inflation data. Traders are watching inflation because it can affect expectations for US interest rates.
If inflation comes in softer than expected, the US dollar and bond yields could face pressure. This can support gold because gold often becomes more attractive when yields and the dollar weaken.
Geopolitical risks are also helping gold demand. Current market reports point to global uncertainty and Middle East tensions as factors supporting safe-haven interest in gold.
For this reason, today’s Gold Market Outlook remains cautiously bullish.
Gold Trading Signals: What Should You Watch?
For traders, the chart is giving a simple message: buyers have the advantage while gold holds above key support.
Still, do not chase a fast move. A good trading plan should include a clear entry, risk limit, and exit target.
Watch these signals:
- A strong break above $4,444 could support further upside.
- Holding near $4,400 would keep the short-term bullish view alive.
- A drop below $4,350 could weaken the buy setup.
- US inflation data could create sharp price moves.
Remember, technical signals are guaranteed. Gold can move quickly, especially around major economic news.
Follow our Instagram page bull & bear whisper for quick market tips, simple charts, daily highlights, and short Gold Trading Signals Today updates.
XAUUSD Analysis and Gold Price Outlook
The current XAUUSD Analysis also points to a positive short-term setup. XAUUSD means the price of gold compared with the US dollar.
Gold recently pushed back above $4,400 after finding buyers around $4,350. This shows that buyers are still interested at lower prices.
For today’s Gold Price Analysis, the main level is $4,444. A clean move above it could strengthen the bullish case. But if gold fails to hold support, traders should become more careful.
The big lesson is simple: follow the price, watch the levels, and manage your risk.
Final Takeaway
The Gold Futures technical analysis 12 August 2026 setup looks bullish, with buyers defending key levels and gold moving back toward $4,400. The Gold Futures Strong Buy bias remains valid while support holds, but upcoming US inflation data could bring extra volatility.
Stay updated with Daily Duniya for simple market analysis and trading news.
For exclusive updates, real-time alerts, and direct access to more content like this, join our WhatsApp channel through the WhatsApp channel link and stay connected with Daily Duniya.