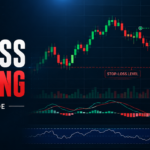
If you have ever looked at a stock chart, you may have noticed small bars sitting below the price line. Most beginners skip past them, but those bars hold one of the simplest and most useful pieces of information in trading: trading volume.
In this guide, Daily Dunia breaks down what trading volume means, why it matters, and how to start reading it like a trader.
What Is Trading Volume?
Trading volume is the number of shares, units, or contracts bought and sold during a specific period, such as one trading day.
Think of a busy market. If 500 people walk into a shop and buy something in a day, that shop has a high footfall. Volume works the same way it tells you how many shares changed hands, not how the price moved.
For example, if a stock sees 2 million shares traded in a day, its trading volume for that day is 2 million. It does not matter whether the price went up, down, or stayed flat; volume only counts activity, not direction.
How Does Trading Volume Work?
Every time a buyer and a seller agree on a price and complete a trade, that transaction adds to the volume count. If someone buys 100 shares from another trader, that single trade adds 100 shares to the day’s total volume.
Volume is tracked continuously while the market is open, and exchanges publish the final total at the end of the day. Most platforms also show volume for shorter time frames, like every minute or hour, which is useful for more active traders.
In short, volume is a running counter of activity. It does not judge whether that activity is good or bad, it just measures it.
Why Is Trading Volume Important?
Trading volume matters because it shows how much interest a stock or asset is getting. Here is why beginners should pay attention to it:
- It shows market interest. High volume usually means more traders and investors are watching or trading a stock.
- It affects how easily you can buy or sell. Stocks with high volume are usually easier to trade quickly, because there are more buyers and sellers ready to make a deal.
- It adds context to price moves. A price change backed by high volume generally reflects broader participation, while the same move on low volume may reflect only a handful of trades.
None of this means volume can predict the future. It simply gives traders more context about what is happening right now.
How to Read Trading Volume
On most trading charts, volume appears as vertical bars below the price chart. Each bar represents the volume for that time period a day, an hour, or even a minute, depending on the chart settings.
Here is how beginners can start reading these bars:
High volume: A tall bar means a lot of shares were traded in that period. This usually happens around big news, earnings announcements, or major market events.
Low volume: A short bar means fewer shares changed hands. This is common during quiet periods, holidays, or when there is little news about the asset.
Increasing volume: When the bars get taller over several periods, it means trading activity is picking up. More people are entering or exiting positions.
Decreasing volume: When the bars get shorter over time, it means fewer people are trading that asset, and interest may be cooling off.
Most charts also color the volume bars often green for periods when the price closed higher and red for periods when it closed lower. This makes it easier to see volume and price direction together at a glance.
If you want to build on this skill, it helps to understand candlestick charts as well, since volume is usually read alongside price candles rather than on its own.
What Is a Volume Indicator?
A volume indicator is a tool built on top of raw volume data. While basic volume just shows the number of shares traded, volume indicators process that data further to highlight patterns. Some common examples include:
- On-Balance Volume (OBV): Adds or subtracts volume based on whether the price closed higher or lower, creating a running total.
- Volume Moving Average: Smooths out volume data over several periods so you can spot whether current volume is above or below its recent average.
- Volume-Weighted Average Price (VWAP): Combines price and volume to show the average price an asset has traded at, weighted by volume.
For a complete beginner, the basic volume bars on a chart are usually enough to start with. Volume indicators become more useful once you are comfortable with reading plain volume and want extra confirmation. If you are curious about other beginner-friendly tools, this guide on trading indicators is a good next step.
Trading Volume and Price Movement
Traders often look at volume alongside price movement rather than in isolation. Here are four combinations beginners commonly come across:
- Price rising + high volume: Often seen as a sign that the upward move has broad participation.
- Price falling + high volume: Often seen as a sign that selling pressure has broad participation.
- Price rising + low volume: May suggest fewer traders are involved in pushing the price up.
- Price falling + low volume: May suggest fewer traders are involved in pushing the price down.
It is important to understand that these combinations describe current market activity they do not guarantee what will happen next. Volume is one piece of a much larger puzzle, and prices can still move in unexpected ways regardless of volume levels.
If you enjoy learning about simple, practical trading and finance concepts like this, Daily Dunia also shares bite-sized lessons on Instagram, which can be a helpful way to review ideas like this on the go.
How Beginners Can Use Trading Volume
Volume works best as part of a bigger toolkit, not as a stand-alone signal. A few simple steps beginners can follow:
- Start by observing, not trading. Watch how volume bars behave during different market conditions before using them in any decisions.
- Combine volume with price action. Look at how volume changes around support and resistance levels to understand participation at key price zones.
- Learn basic chart reading first. A solid grasp of technical analysis makes volume much easier to interpret in context.
- Study chart patterns with volume in mind. Many chart patterns are considered stronger when they form alongside noticeable volume changes.
- Never skip risk management. No matter how convincing a volume signal looks, protecting your capital always comes first.
Treat volume as one input among many, not a shortcut to certainty.
Common Mistakes Beginners Make With Trading Volume
New traders often misuse volume in a few predictable ways:
- Relying only on volume. Volume alone does not tell you why a stock is moving, only that it is being traded.
- Assuming high volume always means the price will rise. High volume can just as easily accompany a falling price.
- Ignoring price action. Volume without price context gives an incomplete picture of what is happening in the market.
- Confusing volume with volatility. These are two different concepts, explained in the next section.
- Making decisions without risk management. Even a well-read volume signal does not remove the need for a clear risk management plan.
Avoiding these mistakes early can save beginners a lot of confusion later on.
Trading Volume vs Volatility
Trading volume and volatility are often mentioned together, but they measure different things.
- Trading volume measures how many shares or contracts are traded.
- Volatility measures how much the price moves, regardless of how many shares were traded.
A stock can have high volume with low volatility if a large number of shares trade at roughly the same price. Similarly, a stock can have high volatility with lower volume if the price swings sharply on relatively few trades.
| Aspect | Trading Volume | Volatility |
| What it measures | Number of shares/contracts traded | Size of price movement |
| Shown as | Bars below the price chart | Price swings on the chart |
| High reading means | Lots of trading activity | Large price changes |
| Low reading means | Little trading activity | Small, steady price changes |
Understanding this difference helps beginners avoid mixing up “a lot of trading” with “a lot of price movement.” They often happen together, but not always.
According to the Nasdaq glossary, trading volume is generally defined as the number of shares transacted during a given period, which is a useful baseline definition to keep in mind as you continue learning.
Conclusion
Trading volume measures how many shares or contracts have changed hands during a set period. On its own, it does not predict where prices are headed, but it does offer useful context about how active a market is.
The best approach for beginners is to treat volume as one part of a wider analysis process used alongside price action, chart patterns, and solid risk management, not as a stand-alone signal.
For more simple trading and finance guides like this one, follow the Bull & Bear Whispers WhatsApp Channel.