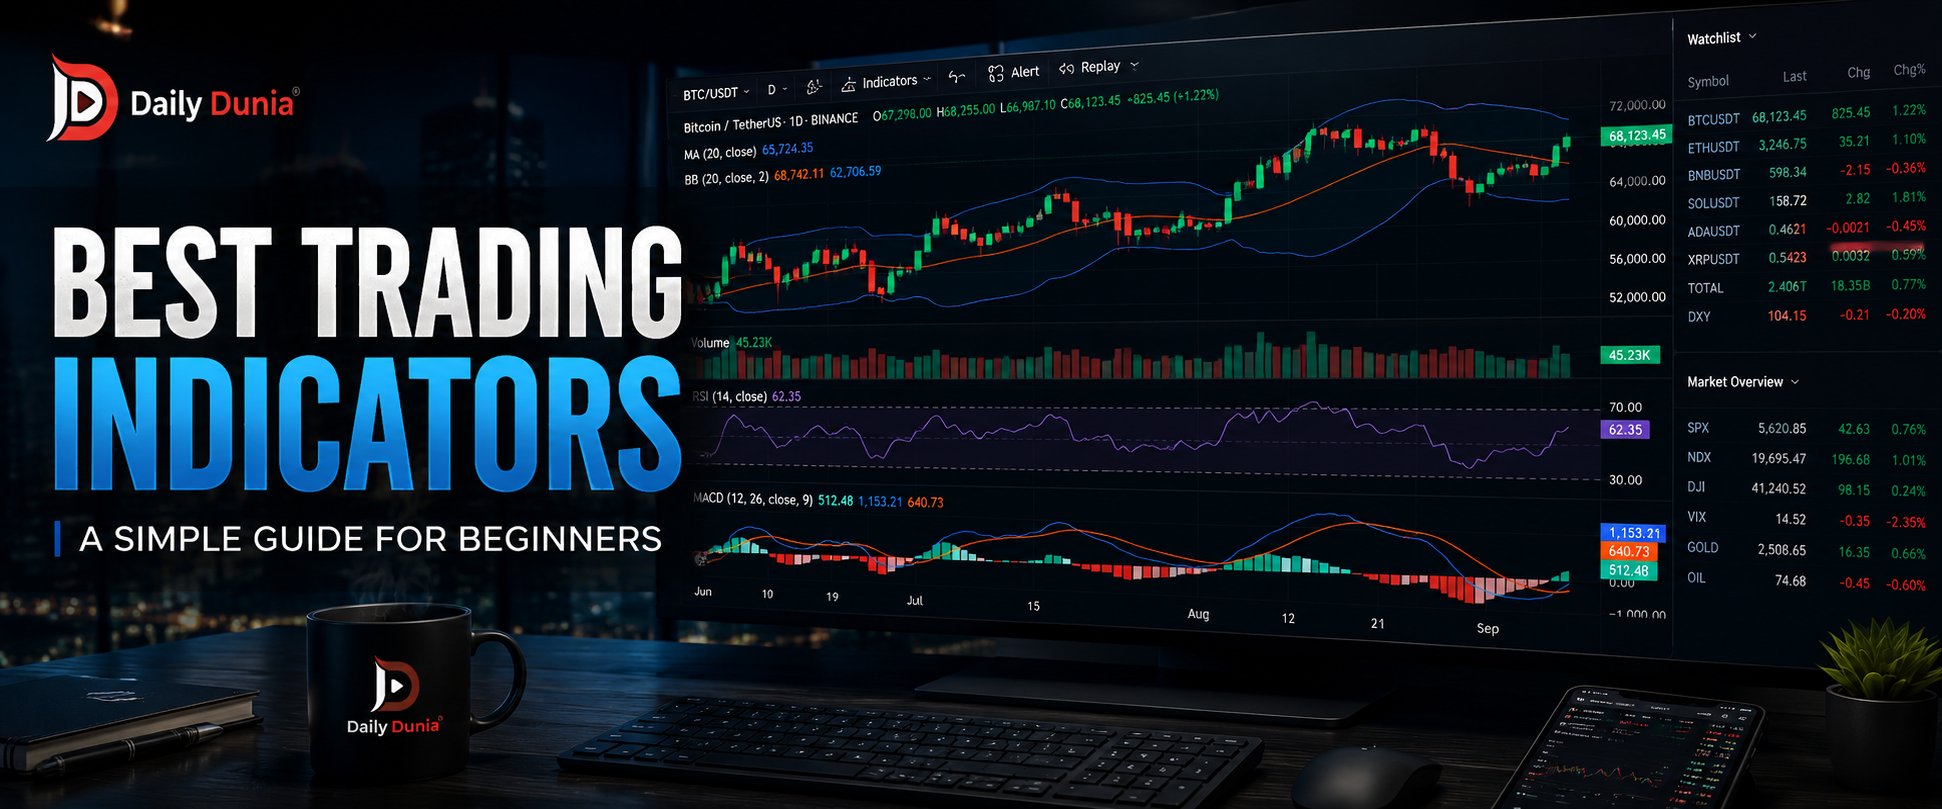
Staring at a stock chart full of lines and colors can feel overwhelming. The good news? You don’t need a finance degree to make sense of it you just need the right tools.
If you’re new to the markets, learning about trading indicators for beginners is one of the smartest first steps you can take. These tools won’t tell you the future, but they will help you read price charts with more confidence and less guesswork.
At Daily Duniya, we cover trading, market updates, and financial news made simple for a young, curious audience. This guide breaks down the most useful indicators in plain English, so you can start understanding charts like a trader — not a mathematician.
What Are Trading Indicators?
A trading indicator is a tool that takes raw price and volume data from a chart and turns it into something easier to read. Instead of staring at hundreds of price points, an indicator does the math for you and shows a simple line, curve, or number.
Think of it like a dashboard in a car. You don’t need to understand the engine to know your speed the speedometer does that for you. Trading indicators work the same way for markets. They summarize what’s happening with price so you can spot patterns faster.
Most indicators are built into free charting platforms, so you don’t need to calculate anything by hand. Your job is simply to understand what each one is telling you.
Why Do Traders Use Technical Indicators?
Traders use technical indicators because raw price charts alone can be noisy and confusing. Prices move up and down every second, and it’s hard for the human eye to spot a genuine trend in the middle of all that movement.
Indicators help by:
- Highlighting the overall direction of a trend
- Showing whether an asset might be overbought or oversold
- Measuring how strong or weak a price move is
- Helping traders decide when to pay closer attention to a chart
It’s important to be realistic here: no indicator can predict the market with certainty. They are tools for analysis, not crystal balls. Traders use them to understand probability and context, not to guarantee an outcome.
Best Trading Indicators for Beginners
There are dozens of indicators out there, but you don’t need to learn them all at once. A small, well-understood toolkit works better than a cluttered chart. Here are some of the best trading indicators that are commonly recommended for people just starting out:
- Moving Averages (MA) – Help smooth out price and show the general trend
- Relative Strength Index (RSI) – Measures momentum and potential overbought/oversold conditions
- Moving Average Convergence Divergence (MACD) – Shows the relationship between two moving averages
- Bollinger Bands – Show how volatile the price has been recently
- Volume – Shows how much trading activity is happening at a given price level
Beginners often start with just one or two of these usually a moving average paired with RSI before adding more tools. If you haven’t yet covered the basics of chart reading, our guide on How to Read Candlestick Charts: A Beginner’s Guide is a good place to start before diving deeper into indicators.
How Moving Averages Work
A moving average takes the average closing price of an asset over a chosen number of periods say, the last 20 days and plots it as a single, smoother line on the chart.
Here’s a simple way to picture it: imagine tracking your daily expenses. Some days you spend more, some days less. If you calculate your average spending over the last 7 days and update it daily, you get a “moving average” of your spending. It smooths out the noisy, day-to-day ups and downs so you can see the bigger trend.
In trading, when the price stays above its moving average, it often suggests an uptrend. When it stays below, it may suggest a downtrend. Some traders also watch for “crossovers” when a shorter-term moving average crosses above or below a longer-term one as a signal worth paying attention to.
Moving averages are considered one of the easiest indicators used in trading to learn, which is why they’re usually the first stop for beginners.
How RSI Helps Traders Understand Market Momentum
The Relative Strength Index, or RSI, is a momentum indicator. It measures how fast and how much a price has moved recently, and displays this as a number between 0 and 100.
In simple terms:
- An RSI above 70 is often considered a sign that an asset may be “overbought,” meaning it has risen quickly and could be due for a pause or pullback.
- An RSI below 30 is often considered a sign that an asset may be “oversold,” meaning it has fallen quickly and could be due for a bounce.
RSI doesn’t tell you exactly when a reversal will happen it simply gives context about how stretched a recent price move has been. Combined with other tools, it becomes part of a bigger picture rather than a standalone signal.
For readers who want the full foundation behind indicators like RSI, our pillar guide, [What Is Technical Analysis in Trading? A Beginner’s Guide], covers the core concepts these tools are built on.
How to Choose the Right Trading Indicator
With so many options available, picking the right indicator can feel confusing. A few simple questions can help:
- What am I trying to understand? Trend direction, momentum, or volatility each have different indicators suited to them.
- Am I overcomplicating my chart? Using five or six indicators at once often creates more confusion, not more clarity.
- Does this indicator match my trading style? Longer-term investors and short-term traders often benefit from different tools and settings.
A good starting combination for most beginners is one trend indicator (like a moving average) and one momentum indicator (like RSI). Once you’re comfortable reading both, you can decide whether adding more tools is genuinely useful. It also helps to understand where price tends to pause or reverse — our guide on [Support and Resistance in Trading: A Beginner’s Guide] pairs well with indicator basics.
By the way, if you enjoy quick, bite-sized market lessons, you can follow the Bull & Bear Whispers Instagram page for short chart breakdowns, useful tips, and daily market highlights a nice way to build your knowledge a little at a time.
Common Mistakes Beginners Should Avoid
Even with the right indicators, beginners often run into the same few mistakes:
- Using too many indicators at once. This often leads to mixed signals rather than clarity.
- Treating indicators as guarantees. No indicator can predict the market with certainty they show probabilities and context, not promises.
- Ignoring the bigger picture. Indicators work best alongside basic chart reading skills, like understanding candlesticks and support/resistance levels. Our guide on Technical Trading Explained: A Beginner’s Guide can help fill in these fundamentals.
- Chasing every signal. Not every crossover or overbought reading needs immediate action. Patience matters as much as the tool itself.
- Skipping risk management. Indicators can inform decisions, but they don’t replace having a plan for how much you’re willing to risk.
Learning to use indicators well takes practice. Start small, watch how they behave in real market conditions, and build your understanding gradually rather than trying to master everything at once. For a technical breakdown of moving averages and RSI from a well-known learning resource, Fidelity’s Technical Indicator Guide is a solid reference to explore further.
Final Thoughts
Trading indicators aren’t magic they’re simply tools that help you read price charts more clearly. Start with the basics like moving averages and RSI, keep your charts uncluttered, and remember that no indicator can promise profits or predict the market with certainty.
Want to keep learning? Join the Bull & Bear Whispers WhatsApp channel for exclusive trading updates, real-time alerts, market highlights, and new beginner-friendly articles delivered straight to you.