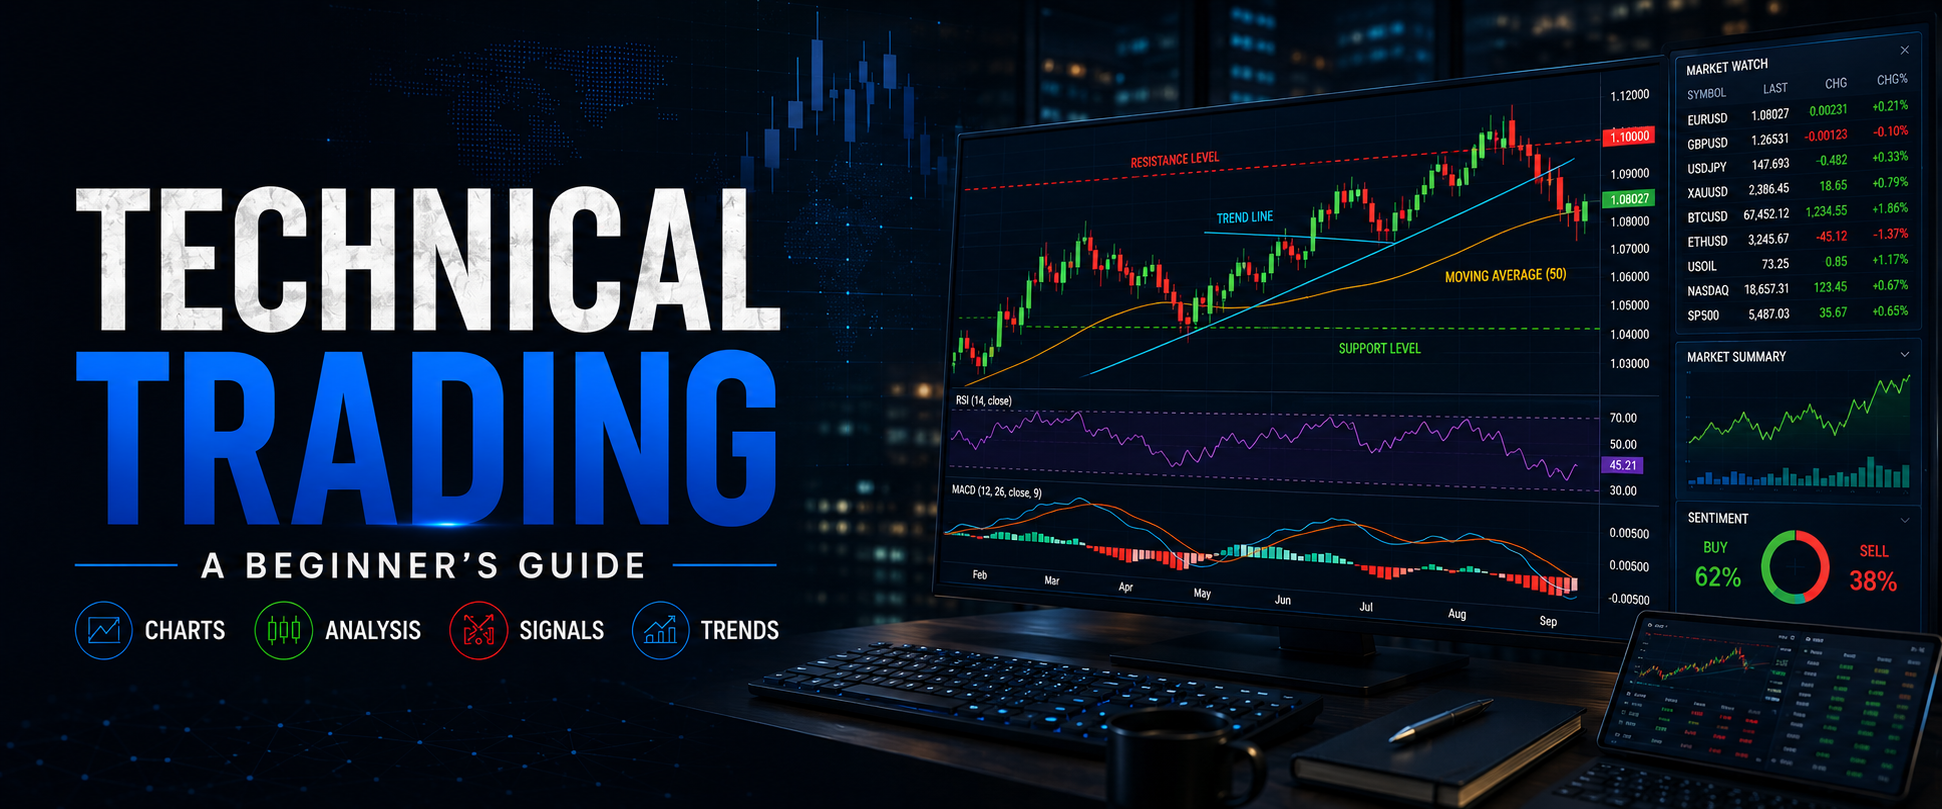
Ever looked at a stock chart and felt totally lost? You’re not alone. Every trader started exactly where you are right now.
Technical trading is a way of making trading decisions by studying price charts instead of guessing. It sounds complicated, but the basic idea is simple: past price movement can help you understand what might happen next. If you’re just getting started, Daily Duniya is a great place to follow daily market updates, trading information, and financial news while you learn.
In this guide, you’ll learn what technical trading is, how it works, and how beginners like you can start learning it step by step.
What Is Technical Trading?
Technical trading means using price charts and patterns to decide when to buy or sell. Instead of looking at a company’s earnings or news, technical traders focus on one thing: price.
The idea is simple. Prices move in patterns. These patterns often repeat. If you learn to spot them, you can make more informed decisions.
Technical trading is closely related to technical analysis, which is the study of these charts and patterns in more detail. If you want a deeper look at that topic, check out our guide on What Is Technical Analysis in Trading? A Beginner’s Guide.
Here’s what technical trading is not:
- It’s not about predicting the future with certainty
- It’s not a guaranteed way to make money
- It’s not based on guessing or luck
It’s a skill. And like any skill, it gets better with practice.
How Does Technical Trading Work?
Technical trading works by studying price charts to spot patterns, trends, and possible turning points.
Here’s a simple breakdown of how it works:
- Step 1: Look at the chart. Traders study how price has moved over time.
- Step 2: Spot the trend. Is the price going up, down, or sideways?
- Step 3: Find key levels. These are prices where the market has reacted before.
- Step 4: Use signals. Traders look for trading signals that suggest a good time to enter or exit.
- Step 5: Manage risk. Smart traders always plan for the chance that they could be wrong.
Two ideas come up a lot in technical trading: support and resistance. These are price levels where the market tends to pause or reverse. If this sounds new to you, our guide on Support and Resistance in Trading: A Beginner’s Guide explains it in plain language.
Understanding market trends is also a big part of this process. A trend simply shows the general direction prices are moving. Spotting the trend early can help you make sense of the bigger picture before you act.
Technical Trading Strategies for Beginners
You don’t need to know everything on day one. Most beginners start with a few simple trading strategies and build from there.
Here are some beginner-friendly approaches:
- Trend following: This means trading in the same direction as the overall trend, instead of against it.
- Breakout trading: This involves watching for the price to move past a key level, which can signal a new move is starting.
- Support and resistance trading: This means buying near support and selling near resistance, based on how price has reacted at those levels before.
- Chart pattern trading: This means learning to recognize simple, repeating shapes on a chart.
One of the most useful early skills is learning to read candlesticks. Each candlestick tells a small story about buyers and sellers. If you’re new to this, our guide on How to Read Candlestick Charts: A Beginner’s Guide is a great next step.
Remember, no strategy works every single time. The goal isn’t to be right every time. It’s to make decisions based on market analysis, rather than guesswork, and to manage risk sensibly along the way.
Want quick, bite-sized lessons while you build these skills? Follow Daily Duniya on Instagram for quick trading tips, chart examples, and daily market highlights that make learning easier.
How Technical Indicators Help Traders
Technical indicators are tools that help traders understand price data more clearly. Think of them as helpers that turn raw numbers into something easier to read.
Some common indicators include:
- Moving averages: These smooth out price data to show the overall direction more clearly.
- RSI (Relative Strength Index): This helps show if a price has moved too far, too fast.
- MACD: This helps traders spot changes in momentum.
- Volume indicators: These show how much buying or selling activity is happening.
Indicators don’t predict the future. They help you understand the present more clearly. Most traders combine two or three indicators, rather than relying on just one.
If you want a simple starting list, our guide on Best Trading Indicators for Beginners: A Simple Guide walks through the basics without overwhelming you.
Common Technical Trading Mistakes
Every trader makes mistakes when starting out. Knowing about them ahead of time can save you time, money, and stress.
Here are common mistakes beginners make:
- Trading without a plan. Jumping in without a clear strategy usually leads to confusion.
- Ignoring risk management. Not setting limits can turn a small loss into a big one.
- Using too many indicators at once. This often creates confusing or conflicting signals.
- Chasing the market. Buying only because the price is rising quickly, without checking the chart first.
- Expecting quick results. Technical trading is a skill that takes time to build. There are no shortcuts, and no strategy guarantees profits.
Being patient and staying disciplined matters more than being right every time.
How to Start Learning Technical Trading
Getting started doesn’t have to be overwhelming. Here’s a simple path beginners can follow:
- Learn the basics first. Understand how charts work before jumping into strategies.
- Study one concept at a time. Start with trends, then move to support and resistance, then indicators.
- Practice with a demo account. This lets you learn without risking real money.
- Follow trusted sources. Reliable market analysis and daily updates can help you build good habits early.
- Review your decisions. Looking back at past trades, even practice ones, helps you improve faster.
If you’re serious about building a strong foundation, our guide on Trading Basics Explained: What Every Beginner Should Know is a good place to start before diving deeper into charts and strategies.
For more structured learning on chart reading, Investopedia’s guide to technical analysis is a widely trusted external resource worth exploring as you go deeper.
Keep Learning With Daily Duniya
Technical trading is a skill anyone can learn with the right approach, patience, and consistent practice. Start with the basics, build one skill at a time, and avoid rushing the process.
Want to stay on top of the markets as you learn? Join our Bull & Bear Whispers WhatsApp Channel for exclusive trading updates, real-time alerts, and new educational content, so you never miss an update while building your trading knowledge.
You can also follow Daily Duniya on Facebook for more daily market news and trading education.