Have you ever looked at a price chart and wondered what those zig-zag lines mean? You’re not alone. Every day, traders around the world study shapes on a chart to guess where the price might go next.
That’s the heart of chart patterns in trading. These are simple shapes that form on price charts over time. They help traders understand market trends and make smarter decisions. If you’re just starting out, don’t worry — chart patterns are easier to learn than they look.
At Daily Duniya, we share trading information, market updates, and financial news to help beginners understand the markets step by step. This guide will walk you through chart patterns in a simple, clear way.
What Are Chart Patterns in Trading?
Chart patterns are shapes that appear on price charts. They form when the price of a stock, currency, or any other asset moves up and down over time.
Traders use these shapes to study past price behavior. The idea is simple: prices often move in patterns because of how buyers and sellers act. When enough people react the same way, a pattern starts to form.
Chart patterns are a key part of technical analysis. Instead of looking at a company’s financial reports, technical analysis focuses on price charts and how price has moved in the past. If you want to understand this bigger picture first, our guide on What Is Technical Analysis in Trading? A Beginner’s Guide is a great place to start.
How Do Trading Chart Patterns Work?
Trading chart patterns work because markets tend to repeat certain behaviors. Human emotions like fear and greed often push prices in similar ways, again and again.
Here’s a simple way to think about it:
- When many traders buy, prices rise.
- When many traders sell, prices fall.
- These waves of buying and selling create shapes on the chart.
Over time, traders noticed that some shapes tend to lead to similar outcomes. That’s why chart patterns became useful trading signals — clues that help traders guess what might happen next.
It’s important to know that chart patterns don’t guarantee anything. They simply show a possibility based on past price behavior. No pattern works 100% of the time, and no trader can predict the market with certainty.
Common Chart Patterns for Beginners
There are many chart patterns, but a few common ones are a great starting point for beginners.
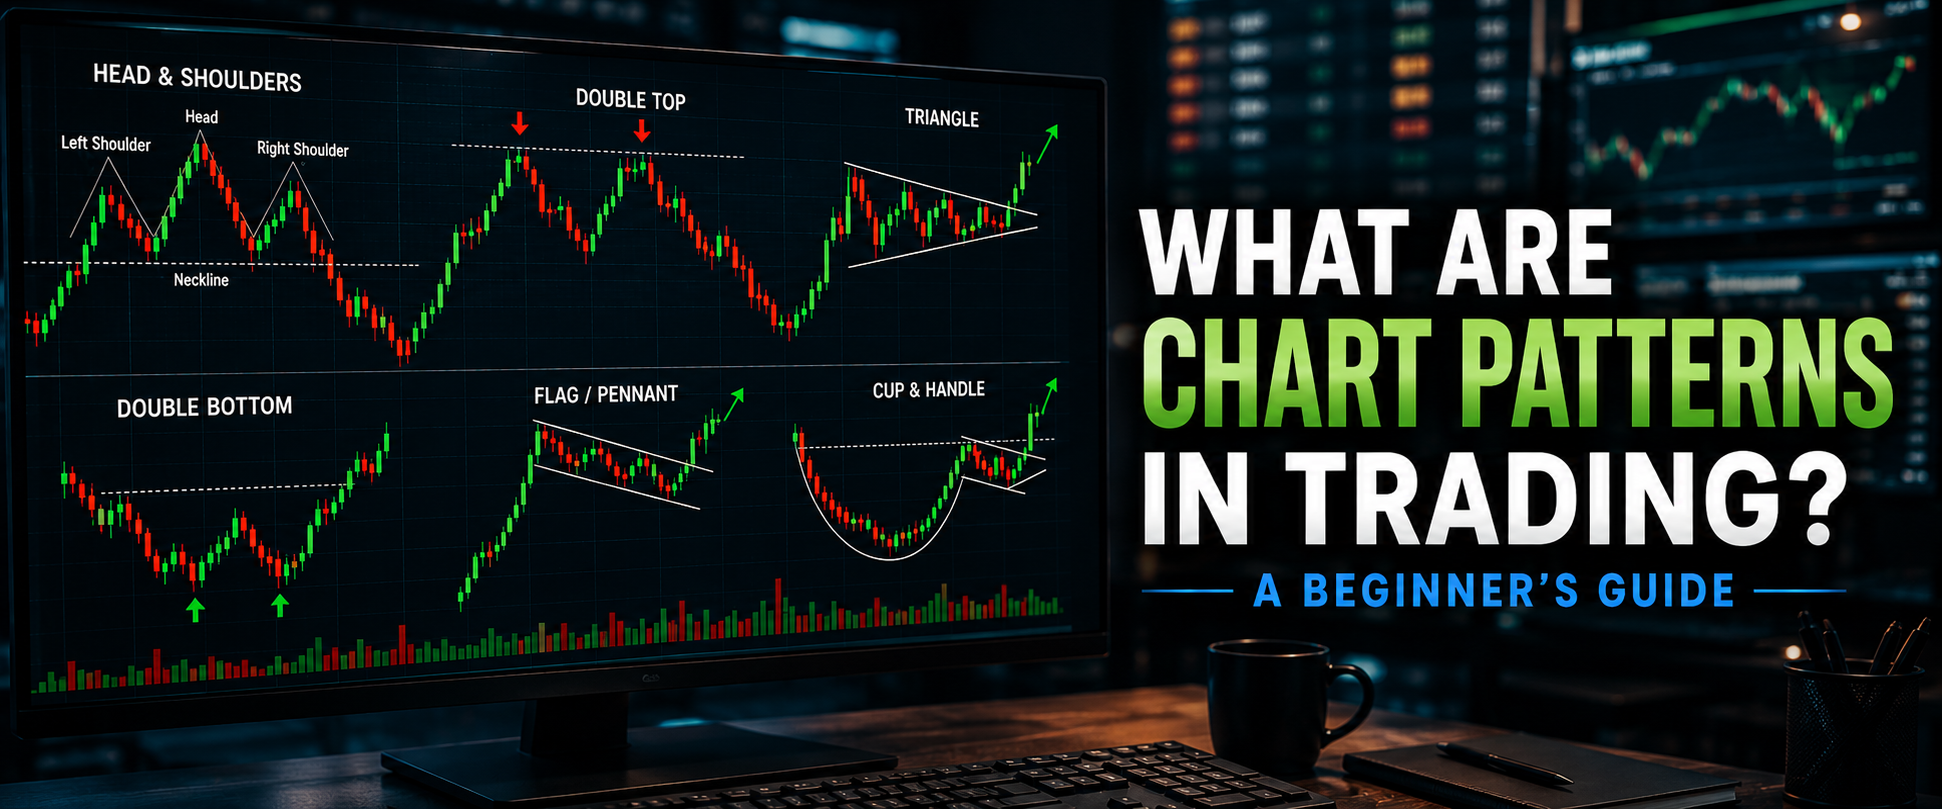
- Head and Shoulders – This pattern looks like three peaks, with the middle one being the tallest. It often signals that a price trend may be about to reverse.
- Double Top and Double Bottom – These patterns show two peaks or two dips at a similar price level. They can hint at a change in direction.
- Triangles – Prices move closer together over time, forming a triangle shape. This often happens before a bigger price move.
- Flags and Pennants – These small patterns usually appear after a strong price move and often mean the trend may continue.
- Cup and Handle – This pattern looks like a “U” shape followed by a small dip. It’s often seen as a sign of upward movement.
These are just a few examples. As you keep learning, you’ll come across more patterns. Pairing this knowledge with candlestick analysis can also help — check out our guide on How to Read Candlestick Charts: A Beginner’s Guide to build a fuller picture of price movement.
For quick visuals and daily examples of these patterns in action, you can also follow the Bull & Bear Whispers Instagram page — it’s a handy place for quick trading tips, charts, and daily market highlights.
How to Use Chart Patterns in Technical Analysis
Chart patterns work best when they’re part of a bigger plan, not used alone. Here’s how beginners typically use them:
- Spot the pattern – Look for a recognizable shape forming on the price chart.
- Confirm with other tools – Many traders check trading indicators alongside patterns to strengthen their analysis. Our guide on Best Trading Indicators for Beginners: A Simple Guide can help here.
- Check support and resistance – Chart patterns often form near key price levels. Learning about Support and Resistance in Trading: A Beginner’s Guide can make pattern reading much clearer.
- Watch trading volume – A pattern backed by higher trading volume is often considered more reliable.
- Wait for confirmation – Many traders wait for the price to actually break out of the pattern before acting, instead of guessing too early.
This step-by-step approach is part of a wider practice called chart analysis, where traders combine several tools instead of relying on just one signal.
Common Mistakes When Reading Chart Patterns
Beginners often make a few common mistakes when they start learning chart patterns. Here are some to watch out for:
- Seeing patterns that aren’t really there. It’s easy to convince yourself a shape is forming, even when the chart doesn’t clearly show it.
- Ignoring the bigger trend. A pattern on a small time frame can look very different from the overall market trends.
- Acting too early. Jumping in before a pattern is confirmed can lead to poor timing.
- Relying on patterns alone. Chart patterns work better when combined with other tools, not used in isolation.
- Expecting guaranteed results. No pattern predicts the future perfectly. Markets are influenced by many factors, and surprises can always happen.
Being aware of these mistakes can save you a lot of frustration as you practice reading charts.
How to Start Learning Chart Patterns
Learning chart patterns is a gradual process, and that’s completely normal. Here are some simple steps to begin:
- Start with the basics. Learn a few common patterns first, rather than trying to memorize all of them at once.
- Practice on historical charts. Look back at old price charts and try spotting patterns yourself.
- Study alongside technical analysis. Understanding the wider world of technical analysis will help patterns make more sense. Our guide on Technical Trading Explained: A Beginner’s Guide is a useful next step.
- Use a demo account. Many trading platforms let you practice without using real money — a safe way to build confidence.
- Stay patient. Reading charts is a skill that improves with time and practice, not something you master overnight.
For a deeper, well-established explanation of chart patterns and technical analysis, resources like Investopedia’s guide to chart patterns are worth exploring.
Final Thoughts
Chart patterns in trading are a simple but powerful tool for understanding price charts and spotting possible market trends. As a beginner, you don’t need to master every pattern right away. Start small, stay curious, and build your knowledge step by step.
Want real-time alerts, exclusive trading updates, and new content as soon as it drops? Join the Bull & Bear Whispers WhatsApp Channel today and stay ahead with the latest market insights.