What Is a Trading Range?
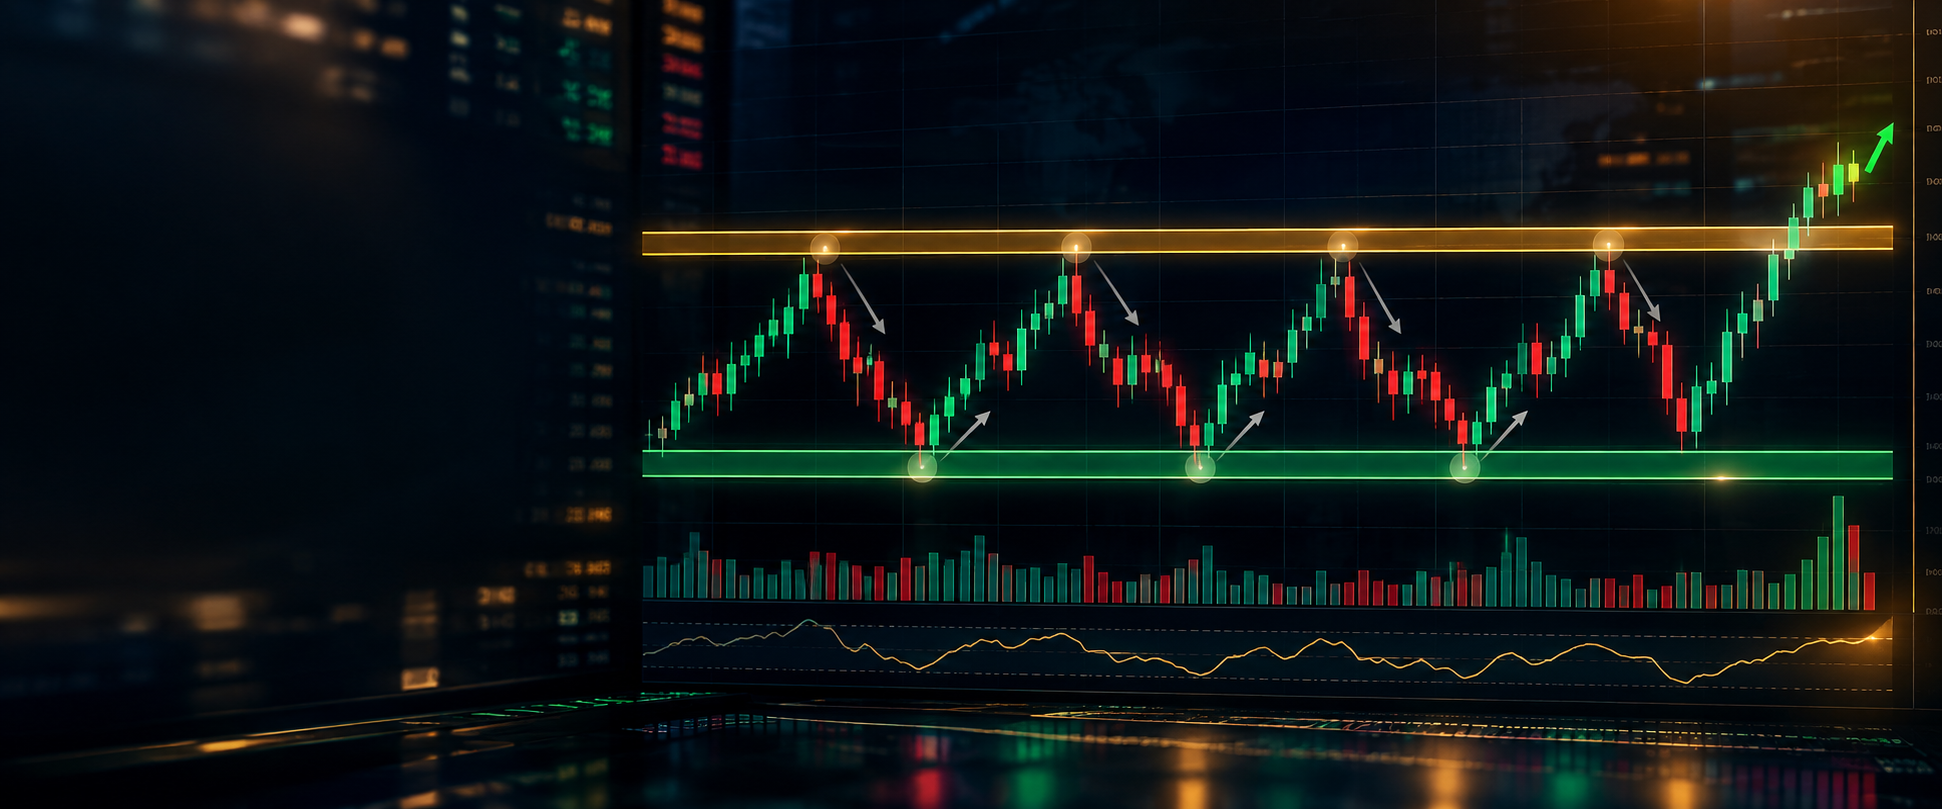
A trading range is a situation where the price of an asset moves between two clear levels for a period of time. Instead of moving strongly upward or downward, the price stays inside a specific area. The upper level acts as resistance, while the lower level works as support.
In simple words, a trading range shows a market where buyers and sellers are balanced. Buyers try to push the price higher near support, while sellers create pressure near resistance. This repeated movement creates a sideways pattern on the chart. citeturn0search14
For example, imagine a stock moving between $50 and $60 for several weeks. Every time the price reaches around $50, buyers enter and push it higher. When it reaches around $60, sellers appear and slow the rise. This movement between two levels creates a trading range.
A trading range is common in financial markets. Stocks, cryptocurrencies, forex pairs, and other assets can spend a long time moving sideways before starting a new trend.
How Does a Trading Range Work?
A trading range works because the market reaches a temporary balance between supply and demand. When buying pressure and selling pressure are almost equal, the price does not move strongly in one direction.
The lower part of the range is called support. This is the area where buyers often become more active. The upper part is called resistance. This is the area where sellers often become stronger. Support and resistance are important concepts in technical analysis because they help traders understand possible price reaction areas. citeturn0search0
A simple example:
| Price Level | Role |
| $100 | Resistance area |
| $90 | Trading range middle |
| $80 | Support area |
If the price moves between $80 and $100 repeatedly, traders may describe the asset as range-bound.
However, traders should remember that markets are unpredictable. A trading range does not mean the price will always stay between these levels. A strong market event, increased buying pressure, or heavy selling can cause the price to leave the range.
Trading Range vs Trending Market: What’s the Difference?
A trading range and a trending market represent two different price conditions.
A trending market moves mainly in one direction. An upward trend creates higher highs and higher lows, while a downward trend creates lower highs and lower lows.
A trading range, on the other hand, does not show a clear long-term direction. The price moves sideways between support and resistance.
The main differences are:
| Trading Range | Trending Market |
| Price moves sideways | Price moves upward or downward |
| Support and resistance are clear | Trend direction is stronger |
| Buyers and sellers are balanced | One side has more control |
| Breakouts become important | Trend continuation is common |
Understanding whether the market is ranging or trending can help traders choose suitable analysis methods. A strategy that works during a trend may not work well in a sideways market.
How Do Support and Resistance Create a Trading Range?
Support and resistance create the structure of a trading range. These two levels act like boundaries that contain price movement.
Support is a price area where falling prices may slow because buyers show interest. Resistance is a price area where rising prices may struggle because selling pressure increases. citeturn0search5
When price repeatedly reacts from these two areas, a range begins to form.
For example:
A cryptocurrency moves from $30,000 to $35,000 several times.
- Around $30,000, buyers step in.
- Around $35,000, sellers become active.
- The price keeps moving between these points.
This creates a range-bound market.
Traders often study these levels using charts, previous price movements, and technical analysis tools. You can also learn more about support and resistance in trading through related educational resources.
How to Identify a Trading Range on a Chart
Identifying a trading range requires observing price behavior over time. Traders usually look for repeated reactions at similar price levels.
Some common signs of a trading range include:
Repeated Highs and Lows
When price reaches a similar high point multiple times and falls back, that area may become resistance. When price reaches a similar low point and rises again, that area may become support.
Sideways Price Movement
A market that moves horizontally without creating strong higher highs or lower lows may indicate a range.
Reduced Momentum
During a trading range, buying and selling pressure may become balanced. This often results in smaller price movements compared with strong trends.
Clear Boundaries
The best-defined ranges usually have visible support and resistance zones. Traders can draw horizontal levels to understand where price has reacted before.
A chart pattern does not guarantee future movement, but it can help traders organize market information.
What Is Range-Bound Trading?
Range trading is a method where traders focus on price movement inside a defined range. Instead of following a strong trend, they look at possible reactions near support and resistance.
In a basic range-bound approach, traders watch whether price approaches the lower or upper boundary of the range.
For example:
A stock moves between $40 and $50.
A trader studying the range may observe:
- $40 area as possible support.
- $50 area as possible resistance.
- Price behavior near both levels.
The goal is not to predict the future with certainty. It is to understand how price behaves in a specific market condition.
Range trading requires patience because some ranges last for days, while others continue for months.
What Is a Trading Range Breakout?
A trading range breakout happens when price moves outside the established range. This means the market may be starting a new movement after spending time between support and resistance.
A breakout above resistance shows that buyers have pushed price beyond the previous limit. A breakdown below support shows that sellers have gained more control.
For example:
A stock trades between $50 and $60 for several weeks. If the price moves above $60 and continues higher, traders may consider this a breakout from the range.
However, not every breakout becomes a strong trend. Some breakouts fail quickly and return back inside the previous range.
This is why traders often look for confirmation instead of reacting immediately to every price movement.
What Is a False Breakout?
A false breakout occurs when price moves outside a trading range but cannot maintain that movement.
For example:
A stock breaks above resistance at $100. Many traders expect further growth. However, the price quickly falls back below $100 and returns inside the previous range.
This situation is called a false breakout.
False breakouts happen because markets can experience temporary buying or selling pressure. Sometimes price moves beyond important levels before reversing direction.
Traders often study volume, price action, and additional technical signals to understand whether a breakout has strength.
How Does Trading Volume Help Identify a Breakout?
Trading volume shows how much buying and selling activity happens during a specific period.
When a breakout occurs with strong volume, some traders consider it a sign that more market participants are supporting the move. Low-volume breakouts may require additional caution because the movement may not have strong participation.
For example:
A stock breaks above resistance with significantly higher trading volume than normal. Traders may view this as stronger participation compared with a breakout that happens with very little activity.
Volume is only one factor. It should be combined with other forms of analysis rather than used alone.
Common Trading Range Mistakes Beginners Make
Beginners often make mistakes when analyzing a range-bound market. Understanding these mistakes can help improve learning and decision-making.
One common mistake is assuming every price movement near resistance or support will create a reversal. Sometimes price breaks through these levels and starts a new trend.
Another mistake is entering trades without confirming the market condition. A market that looks like a range may later develop into a strong upward or downward move.
Some beginners also ignore risk management. Even experienced traders cannot predict every market movement, so managing risk remains an important part of trading.
Learning concepts like chart patterns, technical analysis, and trading volume can help traders develop a more complete understanding.
How Trading Ranges Fit Into a Trading Plan
A trading range can be an important part of a broader trading plan. Traders may use ranges to understand market structure and identify possible areas where price has reacted before.
A good trading plan usually includes:
- Understanding market conditions.
- Studying price behavior.
- Managing risk.
- Reviewing trading decisions.
A trading range should not be viewed as a guaranteed opportunity. Markets can change quickly, and past price behavior does not always repeat.
Educational platforms like Daily Dunia help readers understand concepts such as technical analysis, market patterns, and trading basics in a simple way.
Follow Bull & Bear Whispers on Instagram for more trading education, market insights, and beginner-friendly finance content.
Final Thoughts
A trading range describes a market condition where price moves between support and resistance levels. It shows a period where buyers and sellers are relatively balanced, causing prices to move sideways.
Understanding trading range in technical analysis can help beginners recognize different market conditions. Support and resistance create the structure of the range, while breakouts can signal a possible change in price direction.
However, traders should avoid assuming every breakout is real. Confirming price movement through additional analysis, including volume and market behavior, can help create a more informed approach.
Get the latest trading education and market updates by joining the Bull & Bear Whispers WhatsApp Channel.
This article is for educational purposes only and is not financial advice. Trading involves risk, and results are not guaranteed.