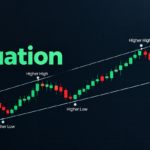
Trendlines in trading are simple diagonal lines drawn on price charts to show the general direction of market movement. Traders use them to study trends, identify dynamic support and resistance, and observe possible breakouts.
A trendline can help organize price action, but it is not a guaranteed signal. Like other tools used in technical analysis, it works best when combined with price structure, volume, and a clear trading plan.
What Are Trendlines in Trading?
What is a trendline? A trendline is a straight line that connects two or more important swing points (highs or lows) on a chart.
- In an uptrend, the trendline is drawn below the price by connecting higher lows.
- In a downtrend, the trendline is drawn above the price by connecting lower highs.
These lines create a visual path that shows how price has been moving and where it might find trendline support and resistance in the future.
How Do Trendlines Work?
Trendlines work by highlighting the slope and pace of a trend.
- An upward sloping line shows buyers are generally in control.
- A downward sloping line shows sellers are generally in control.
Each time price comes back to the trendline and reacts (bounces or rejects), the line becomes more significant. Many traders look for at least three touches to consider a trendline strong and valid.
How to Draw an Uptrend Line
How to draw trendlines in an uptrend:
- Find a clear uptrend – price making higher highs and higher lows.
- Locate two major swing lows – the lowest point and the next higher low.
- Connect the lows with a straight line and extend it to the right.
- Wait for a third touch – when price comes back to the line and bounces again, the uptrend trendline is more reliable.
This line now acts as dynamic support in the uptrend.
How to Draw a Downtrend Line
For a downtrend:
- Find a clear downtrend – price making lower highs and lower lows.
- Locate two major swing highs – the highest point and the next lower high.
- Connect the highs with a straight line and extend it to the right.
- Look for a third touch – when price rises back to the line and gets rejected again, the downtrend trendline is stronger.
This line now acts as dynamic resistance in the downtrend.
Trendlines as Support and Resistance
Trendlines often behave like moving support and resistance levels:
- In an uptrend, the trendline below the price acts as trendline support.
- In a downtrend, the trendline above the price acts as trendline resistance.
Unlike horizontal support/resistance zones, trendlines are diagonal and adjust as the trend moves. This makes them useful for studying trend continuation and potential trend reversal areas.
For more on horizontal levels, you can read about support and resistance in trading on Daily Dunia.
How Traders Use Trendlines
Traders use trendline trading in several ways:
- Studying trend direction – to confirm if the market is in an uptrend, downtrend, or ranging.
- Finding entry areas – watching for bounces near the trendline in the direction of the trend.
- Planning exits – using the trendline as a reference for where the trend might weaken.
- Spotting breakouts – noticing when price moves decisively through the trendline.
Trendlines are not used alone. They are combined with other tools like candlestick patterns, volume, and horizontal levels as part of technical analysis.
If you want to understand the bigger picture of chart reading, Daily Dunia’s article on what is technical analysis in trading explains the basics.
Trendline Breakouts and What They Mean
A trendline breakout happens when price moves through the trendline instead of bouncing from it.
- In an uptrend, a breakout below the trendline suggests the previous upward pace may be slowing.
- In a downtrend, a breakout above the trendline suggests the downward pressure may be weakening.
A breakout does not always mean a full trend reversal. It can also lead to:
- A trend continuation after a pause
- A sideways range before the next move
- Or sometimes, a false breakout where price briefly breaks and then returns
Daily Dunia covers these ideas in articles like trend continuation in trading, trend reversal in trading, and false breakout in trading.
Trendlines vs Support and Resistance
Both trendlines and horizontal support and resistance show important price zones, but they are different:
- Horizontal support/resistance: fixed price levels where price has reacted before.
- Trendlines: diagonal levels that move with the trend and show dynamic support/resistance.
Many traders use both together:
- Horizontal levels for key static zones
- Trendlines for dynamic zones that follow the trend
This combination can give a clearer view of where price might react next.
Common Trendline Mistakes Beginners Make
Beginners often make these mistakes in trendline trading:
- Drawing too many lines – cluttering the chart and creating confusion.
- Connecting small wicks only – instead of major swing highs/lows.
- Forcing a trendline – drawing lines where no clear trend exists.
- Ignoring the third touch – treating any two-point line as strong without confirmation.
- Using trendlines as guaranteed signals – expecting exact bounces or breaks every time.
Trendlines are tools for analysis, not crystal balls. They work best when used with other evidence from the chart.
How to Use Trendlines in a Trading Plan
To use trendlines in trading properly:
- Start with a clean chart – remove unnecessary indicators and focus on price.
- Identify the main trend – uptrend, downtrend, or range.
- Draw only clear, major trendlines – connecting significant swing points.
- Combine with other signals – such as candlestick patterns, volume, and horizontal levels.
- Define your rules – for entries, exits, and risk management around trendline bounces and trendline breakouts.
- Practice on a demo account – before using real money.
Learning how to read a trading chart and understanding breakouts in trading can help you build a stronger plan around trendlines.
Final Thoughts
Trendlines in trading are powerful visual tools for studying market direction, dynamic support and resistance, and potential breakouts.
Used correctly, they can improve your chart reading and help you think more clearly about trendline support and resistance, uptrend trendlines, and downtrend trendlines.
Remember:
- Trendlines are part of technical analysis, not guaranteed signals.
- Always combine them with other evidence and a solid trading plan.
- Never treat them as a shortcut to profits or a replacement for risk management.
For more beginner-friendly lessons on charts and patterns, follow Daily Dunia on Instagram. You can also join the Bull & Bear Whispers WhatsApp Channel for updates, educational articles, and new trading topics.