

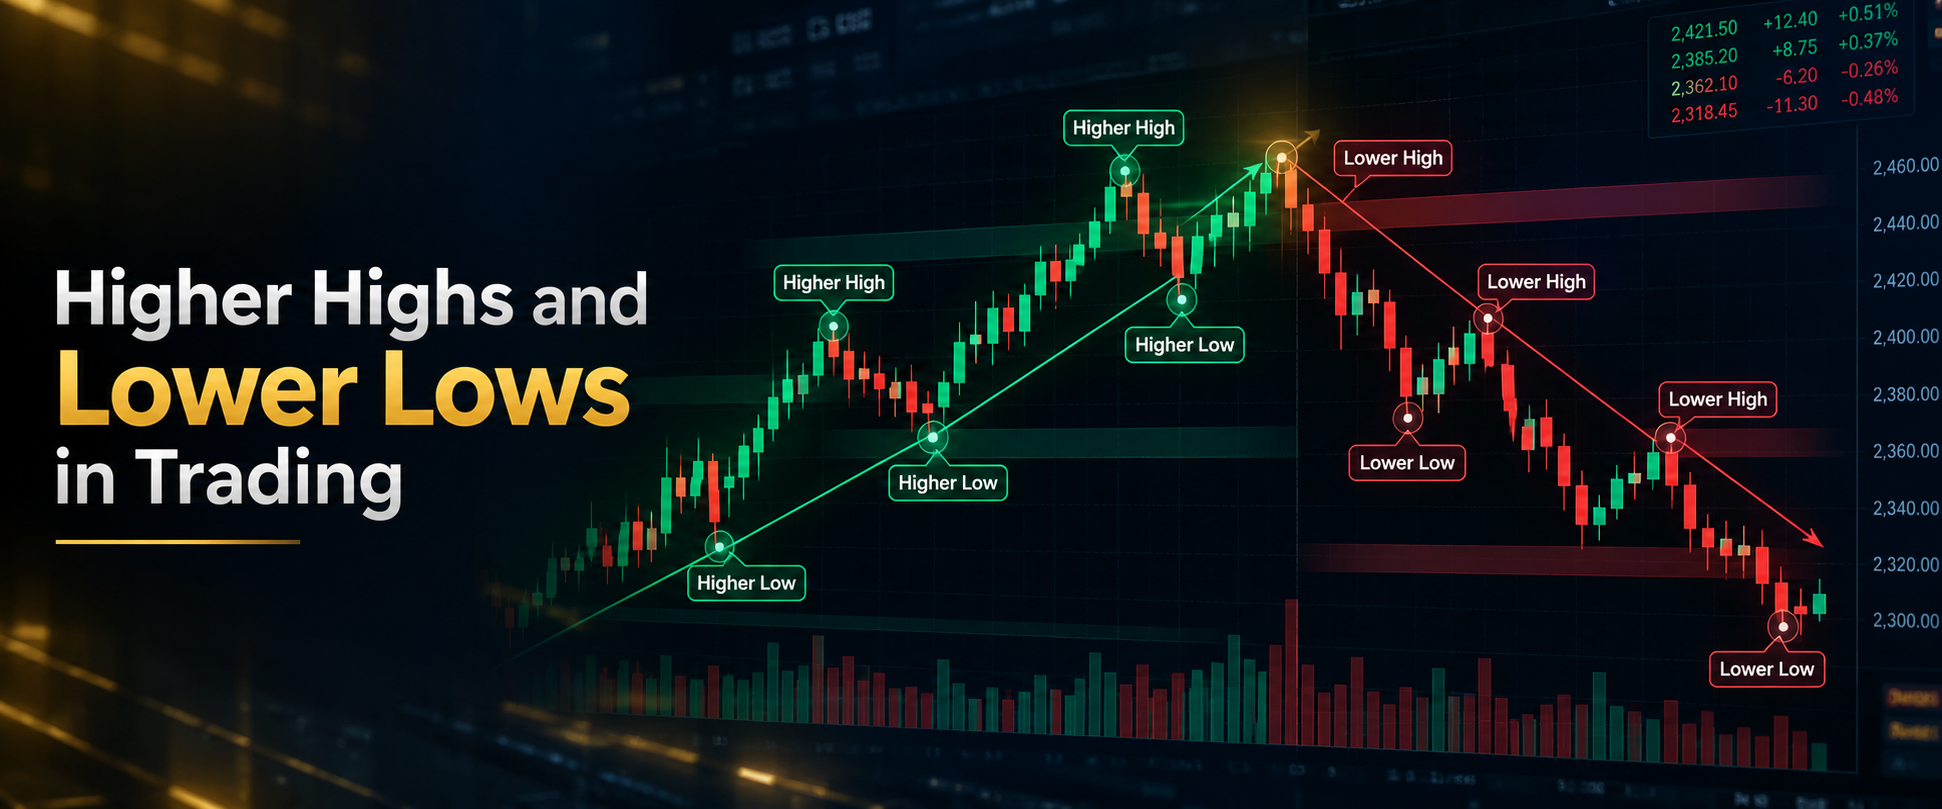
If you want to read charts with confidence, start with higher highs and lower lows. These simple patterns show who is in control buyers or sellers and help you identify the trend before you plan entries or exits. At Daily Dunia, we break down price action into clear, practical lessons so beginners can build a strong foundation in technical analysis.
What Are Higher Highs and Lower Lows?
In price action, a high is a peak where price turns down, and a low is a trough where price turns up.
- A Higher High (HH) forms when the latest peak is above the previous peak.
- A Lower Low (LL) forms when the latest trough is below the previous trough.
These swing points create the backbone of market structure in trading. When you see a sequence of HHs, it suggests buyers are pushing price higher. When you see a sequence of LLs, it suggests sellers are pushing price lower.
How Higher Highs Show an Uptrend
An uptrend is defined by a repeating pattern: Higher High → Higher Low → Higher High, and so on. Each new high breaks above the last resistance, and each pullback stops above the last support. This “staircase” shape shows growing bullish momentum.
Simple example:
- Price makes a high at 100.
- It pulls back to 95 (a low).
- Then it rallies to 105. That 105 is a higher high.
- If the next pullback holds above 95 (say at 98), that 98 is a higher low.
Together, 105 and 98 confirm the uptrend structure.
For more on drawing trend direction, see our guide on Trendlines in Trading.
How Lower Lows Show a Downtrend
A downtrend shows the opposite pattern: Lower Low → Lower High → Lower Low. Each new low breaks below the last support, and each bounce fails below the last resistance. This shows sustained selling pressure.
Simple example:
- Price makes a low at 200.
- It bounces to 210 (a high).
- Then it drops to 190. That 190 is a lower low.
- If the next bounce stalls below 210 (say at 205), that 205 is a lower high.
Together, 190 and 205 confirm the downtrend structure.
To learn how trends can flip, read our article on Trend Reversal in Trading.
What Are Higher Lows and Lower Highs?
Besides HH and LL, two more swing types complete the picture:
- Higher Low (HL): A pullback that forms a trough above the previous low. It shows buyers stepping in earlier.
- Lower High (LH): A bounce that forms a peak below the previous high. It shows sellers defending lower prices.
In an uptrend, you expect HH + HL. In a downtrend, you expect LL + LH. When these pairs break, the trend may be weakening or changing.
For context on trend continuations, see Trend Continuation in Trading.
How to Read Market Structure Using Price Swings
Market structure is simply the map of swing highs and swing lows on your chart. To read it:
- Mark the most recent clear swing high and swing low.
- Compare the latest high to the previous high: is it higher or lower?
- Compare the latest low to the previous low: is it higher or lower?
- Label the sequence: HH/HL (uptrend) or LL/LH (downtrend).
This process is core to identifying market trends without indicators. It keeps your analysis clean and focused on price action.
If you are new to charts, start with our beginner explainer: How to Read a Trading Chart.
Higher Highs and Lower Lows vs Trendlines
Trendlines connect swing points to visualize direction:
- In an uptrend, draw a line under higher lows.
- In a downtrend, draw a line over lower highs.
Higher highs and lower lows tell you what the structure is. Trendlines show you where the trend may find support or resistance. When price breaks a trendline, watch the next swing: does it create a contrary HH/LL or fail to make one? That often signals a Breakouts in Trading or a potential reversal.
How Market Structure Can Change
Trends do not last forever. Structure changes when the expected pattern breaks:
- In an uptrend, if price makes a Lower Low below the last HL, the uptrend is under stress.
- In a downtrend, if price makes a Higher High above the last LH, the downtrend is under stress.
This is why traders watch for break of structure after a strong move or a Pullbacks in Trading. A single break does not guarantee a new trend, but it warns you to reassess bias and risk. Remember: market structure is an analytical tool, not a crystal ball.
How Traders Use Price Structure in Technical Analysis
In technical analysis, structure guides decisions:
- Trend bias: HH/HL = bullish bias; LL/LH = bearish bias.
- Entry zones: Buy near HL in uptrends; sell near LH in downtrends.
- Invalidation: If HL breaks in an uptrend, the bullish idea may be wrong. If LH breaks in a downtrend, the bearish idea may be wrong.
- Targets: Prior HH or LL levels often act as future resistance or support.
This approach keeps your plan aligned with the chart’s story. For a bigger picture, see What Is Technical Analysis in Trading? and our piece on Support and Resistance in Trading.
Common Mistakes Beginners Make
- Counting every small wiggle: Focus on clear swing points, not tiny noise.
- Ignoring timeframes: Structure on a 5‑minute chart may differ from the daily chart. Always check the higher timeframe for context.
- Assuming guarantees: A HH or LL pattern does not promise the next move. It shows probability, not certainty.
- Chasing breakouts without confirmation: Wait for the swing to complete (a clear HH or LL) before changing bias.
How to Include Market Structure in a Trading Plan
A simple, rules‑based plan can look like this:
- Define trend: Mark HH/HL or LL/LH on your chosen timeframe.
- Entry trigger: Look for pullbacks to HL (in uptrend) or LH (in downtrend) with a clear rejection candle.
- Risk management: Place stops beyond the last swing that invalidates your idea.
- Targets: Aim for prior HH/LL or measured moves, not random levels.
- Review: If structure breaks against you, exit and reassess no hero trades.
This keeps your process disciplined and repeatable.
FAQs
What do higher highs mean in trading?
A higher high means the latest peak is above the previous peak, showing buyers are pushing price to new levels and the uptrend is intact.
What do lower lows mean in trading?
A lower low means the latest trough is below the previous trough, showing sellers are driving price down and the downtrend is intact.
What is the difference between a higher high and a higher low?
A higher high is a new peak above the last peak. A higher low is a pullback that forms a trough above the last trough. Together they confirm an uptrend.
Can market structure change during a trend?
Yes. If an uptrend makes a lower low, or a downtrend makes a higher high, the structure is breaking and the trend may be weakening or reversing.
Why is market structure important in technical analysis?
Because it shows the sequence of buyer and seller control without indicators. It helps you identify trends, plan entries, and set logical invalidation points.
For deeper study, a reliable external reference is Investopedia’s overview of trend and market structure concepts.
Final Thoughts
Higher highs and lower lows in trading are the simplest way to read market structure, spot uptrend and downtrend phases, and align your trades with price action. Use them with clear rules, respect risk, and remember that structure guides probability not guarantees. At Daily Dunia, we turn complex technical analysis into practical, people‑first lessons. Follow our Instagram for quick chart breakdowns, and join our Bull & Bear Whispers WhatsApp Channel for new articles and updates as soon as they go live.


