The doji is one of the most common candlestick patterns you will see on any chart. It forms when buyers and sellers end a period roughly balanced, showing indecision in the market. If you keep spotting this thin, cross-shaped candle and wondering what is a doji candlestick, this Daily Dunia guide explains what a doji candlestick is, the main types of doji, and how traders use them with confirmation on their charts.
We will also cover what a doji can and cannot tell you, so you avoid the most common mistakes.
What Is a Doji Candlestick?
A doji candlestick is a candle where the open and close prices are equal or almost equal, so the body looks like a thin line or a very small box. It shows that neither buyers nor sellers won control during that period, even if price moved up and down in between.
The wicks, also called shadows, can be short or long. They show the highest and lowest prices reached before price returned to its opening level.
Hypothetical example: a stock opens at $50.00, rises to $51.00, falls to $49.00, and closes at $50.02. The tiny gap between open and close creates a doji.
If you are still learning how candles are built, start with our guide to candlestick charts.
What Does a Doji Candle Mean?
A doji candle means buyers and sellers were roughly balanced during that period. Both sides pushed price at some point, but neither could hold its advantage by the close.
That is the core doji meaning in trading: indecision. On its own, it does not tell you which way price will go next.
What a doji candle means depends heavily on where it appears:
- After a strong trend: it may suggest momentum is slowing.
- At support or resistance: it may show that buyers or sellers are starting to defend a level.
- In a sideways market: it often means very little, because indecision is already normal there.
This is why the doji candlestick pattern is best read as a question mark on the chart, not an answer.
Types of Doji Candlesticks
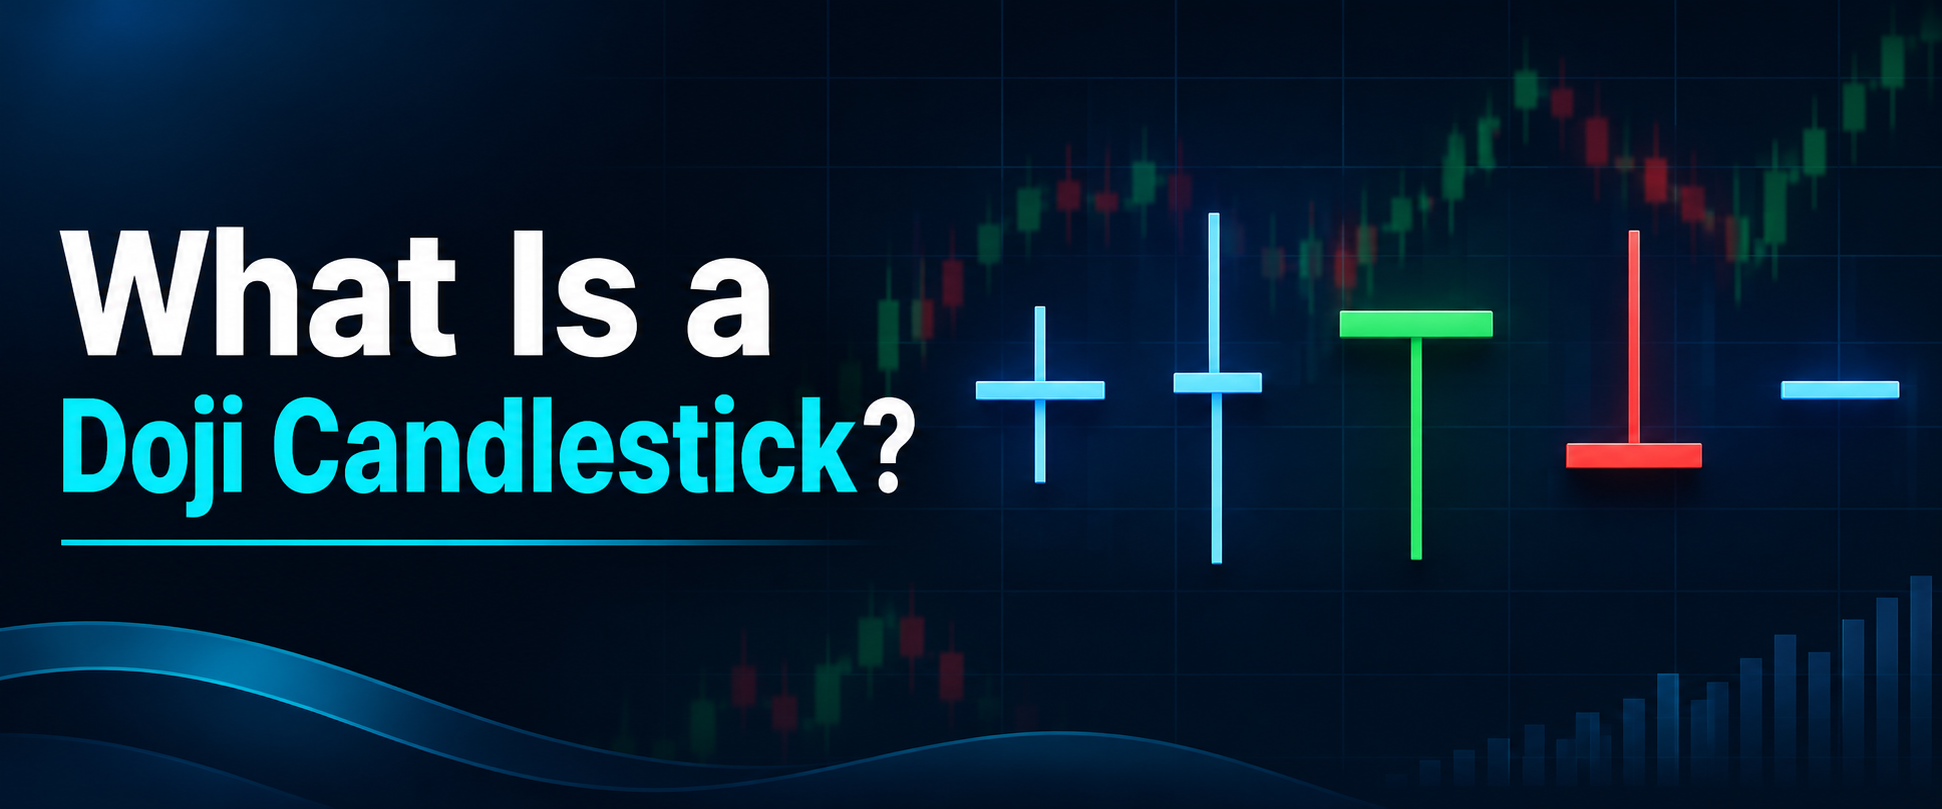
There are five main types of doji, each with a slightly different shape and message.
Standard (Neutral) Doji
A standard doji has a very thin body in the middle, with short upper and lower wicks of similar length. It looks like a small cross or plus sign and shows simple, balanced indecision.
Long-Legged Doji
A long-legged doji has a thin body with long upper and lower wicks. Price swung strongly in both directions but closed near where it opened, showing high uncertainty and volatility.
Dragonfly Doji
A dragonfly doji has a long lower wick and little or no upper wick, with the open and close near the high. It looks like a “T.” Sellers pushed price down, but buyers pushed it back up. It is often discussed as a possible bullish sign near support.
Gravestone Doji
A gravestone doji has a long upper wick and little or no lower wick, with the open and close near the low. It looks like an upside-down “T.” Buyers pushed price up, but sellers pushed it back down. It is often discussed as a possible bearish sign near resistance.
Four-Price Doji
A four-price doji forms when the open, high, low and close are almost the same, so it looks like a flat dash. It is rare and usually appears in very low-activity periods, such as illiquid markets or holidays.
| Doji Type | How It Looks | What It May Suggest |
|---|---|---|
| Standard | Thin body, short wicks on both sides | Simple indecision |
| Long-Legged | Thin body, long wicks on both sides | Strong indecision and volatility |
| Dragonfly | Long lower wick, little or no upper wick | Possible bullish sign near support |
| Gravestone | Long upper wick, little or no lower wick | Possible bearish sign near resistance |
| Four-Price | A flat dash with almost no range | Very low activity |
Is a Doji Bullish or Bearish?
A doji on its own is neutral. It shows indecision, not direction.
Whether a doji turns out bullish or bearish depends on context and on the candles that follow. A dragonfly doji at strong support, followed by a strong green candle, may lead to a move higher. The same doji in the middle of a downtrend, followed by another red candle, may mean nothing at all.
So, is a doji bullish or bearish? Neither, until the market shows its next move. Many traders wait for a candle that closes clearly beyond the doji’s high or low before forming a view.
How to Trade a Doji Candlestick
To trade a doji, look at where it forms, wait for confirmation, check the trend and manage your risk. Here is how to trade a doji step by step.
Look at the Location
A doji near a key level matters far more than one in the middle of nowhere. A doji at support and resistance can show that one side is starting to defend the level. Learn how to mark these zones in our guide to support and resistance.
Wait for Confirmation
Do not act on the doji alone. Wait for the next candle to close in a clear direction, ideally beyond the doji’s high or low. This kind of breakout confirmation helps filter out many false signals.
Check the Trend
A doji after a long trend may warn that momentum is slowing, but trends often continue after a brief pause. Understanding trend continuation helps you avoid calling a reversal too early.
Manage Risk
Place your stop-loss just beyond the doji’s high or low, depending on your trade direction.
Hypothetical example: a dragonfly doji forms at support, with a high of $40.50 and a low of $39.00. The next candle closes at $41.20, above the doji’s high. You buy at $41.20 with a stop at $38.90, just below the doji’s low. That is $2.30 of risk. A target of $45.80 gives $4.60 of reward, a 1:2 ratio.
Common Mistakes When Trading Doji Patterns
Most doji mistakes come from reading too much into a single candle:
- Treating every doji as a reversal: many dojis are just short pauses in a trend.
- Ignoring trend and location: a doji in a choppy range rarely means much.
- Trading without confirmation: entering before the next candle closes adds unnecessary risk.
- Using very small time frames: dojis on 1-minute charts appear constantly and are mostly noise.
- Ignoring risk management: always use a stop-loss and sensible position size.
Waiting one extra candle costs little compared with acting on a false signal.
Frequently Asked Questions
What is a doji candlestick in simple words?
A doji is a candle where the open and close are almost the same price. It shows that buyers and sellers were balanced during that period.
Is a doji a reversal signal?
Not by itself. A doji shows indecision, and it only suggests a possible reversal when it appears at a key level and is followed by a confirming candle.
What is the difference between a dragonfly and gravestone doji?
A dragonfly doji has a long lower wick and is often seen as a possible bullish sign near support. A gravestone doji has a long upper wick and is often seen as a possible bearish sign near resistance.
Which time frame is best for doji patterns?
Higher time frames, such as the 4-hour and daily charts, usually give more meaningful dojis. On very small time frames, they appear often and carry less weight.
Final Thoughts
So, what is a doji candlestick? It is a candle with almost equal open and close prices that shows indecision between buyers and sellers. Its meaning depends on where it forms, the trend around it and the candles that follow. Treat a doji as a warning to pay attention, not a signal to act on its own, and always use a stop-loss.
To keep learning candlestick patterns in simple words, explore more beginner guides on Daily Dunia.