What Is a Breakout in Trading?
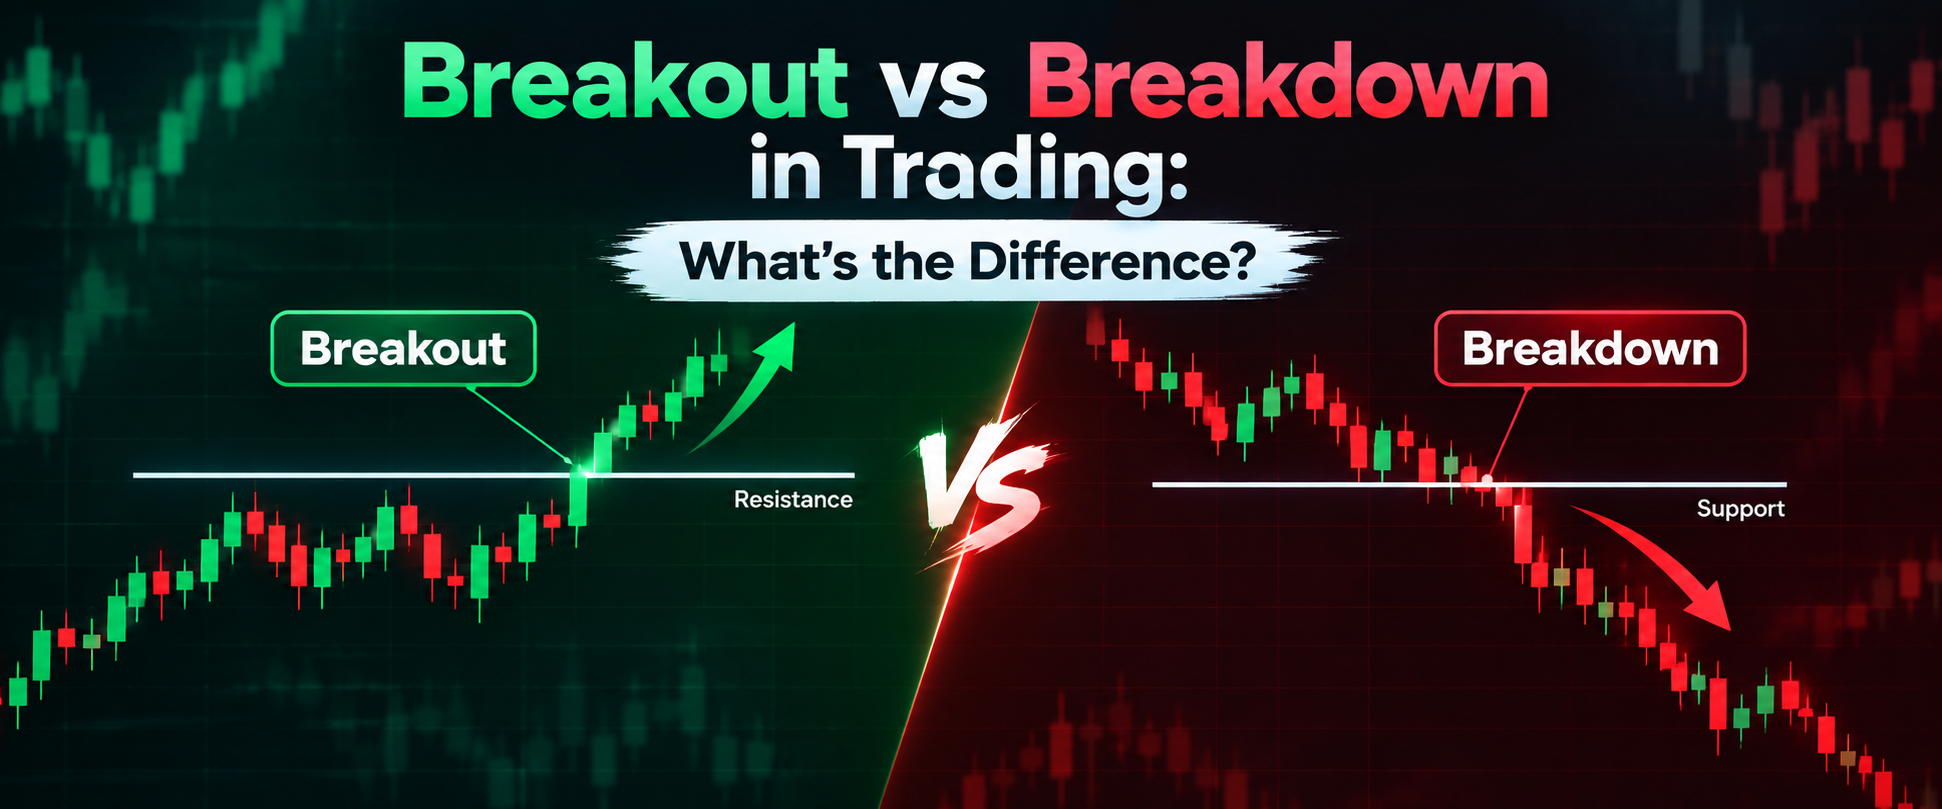
A breakout happens when the price of a stock, crypto, or any trading asset moves above a key resistance level. This shows that buyers have taken control and the price may continue rising.
Think of resistance as a “ceiling” that the price has tried to break through multiple times but failed. When the price finally breaks above this ceiling with strength, it’s called a bullish breakout.
For example, if a stock has been stuck below Rs. 100 for weeks, and then suddenly moves to Rs. 105 with high volume, that’s a breakout. Traders see this as a signal that the price might go higher.
Breakouts are important in technical analysis because they often mark the start of a new uptrend. However, not every breakout is genuine—some turn out to be false breakouts that quickly reverse.
What Is a Breakdown in Trading?
A breakdown is the opposite of a breakout. It happens when the price moves below a key support level, showing that sellers have taken control and the price may continue falling.
Support acts like a “floor” that has held the price up multiple times. When the price breaks below this floor with strength, it’s called a bearish breakdown.
For example, if a stock has been staying above Rs. 90 for weeks, and then drops to Rs. 85 with high volume, that’s a breakdown. Traders see this as a signal that the price might go lower.
Just like breakouts, breakdowns can also be fake. Sometimes the price breaks below support but quickly bounces back up. This is why confirmation is important before entering a trade.
Breakout vs Breakdown: Key Difference
The main difference between a breakout and breakdown is the direction of the price move:
| Breakout | Breakdown |
| Price moves above resistance. | Price moves below support. |
| Shows buying pressure (bullish). | Shows selling pressure (bearish). |
| Traders expect prices to go up. | Traders expect prices to go down. |
| Often followed by a retest where resistance becomes support. | Often followed by a retest where support becomes resistance. |
| Traders may enter long positions (buy). | Traders may enter short positions (sell). |
Both breakouts and breakdowns are signs that the market is moving out of a trading range (sideways movement) into a new trend. The key is to confirm that the move is real before trading.
How Support and Resistance Help Identify Them
Support and resistance are the foundation for identifying breakouts and breakdowns.
- Support is a price level where buying pressure is strong enough to stop the price from falling further.
- Resistance is a price level where selling pressure is strong enough to stop the price from rising further.
To identify a breakout:
- Find a clear resistance level where the price has reversed multiple times.
- Watch for the price to move above that level with strength.
- Confirm with volume and other signals.
To identify a breakdown:
- Find a clear support level where the price has bounced multiple times.
- Watch for the price to move below that level with strength.
- Confirm with volume and other signals.
The more times a level has been tested (touched and reversed), the more important it becomes. A breakout or breakdown from a well-tested level is usually more reliable.
How to Confirm a Breakout or Breakdown
Not every price move above resistance or below support is a real breakout or breakdown. Here’s how traders confirm them:
- Wait for a strong close: The price should close clearly above resistance (for breakout) or below support (for breakdown), not just touch it briefly.
- Check trading volume: A genuine breakout or breakdown usually comes with higher-than-average volume. Low volume suggests weak conviction.
- Look for follow-through: After the initial move, the price should continue in the same direction. If it immediately reverses, it might be a fake.
- Watch for a retest: After a breakout, the price often pulls back to test the broken resistance (now support). After a breakdown, it may rally back to test the broken support (now resistance). A successful breakout retest adds confirmation.
- Use candlestick patterns: Strong bullish candles (for breakouts) or bearish candles (for breakdowns) add confidence to the move.
Confirmation reduces the risk of falling for false signals, but it does not eliminate risk entirely.
The Role of Trading Volume
Trading volume is one of the most important tools for confirming breakouts and breakdowns.
Here’s what volume tells you:
- High volume on breakout/breakdown: Shows strong buying or selling pressure. This increases the chance that the move is genuine.
- Low volume on breakout/breakdown: Suggests weak conviction. The move may fail quickly, leading to a false breakout or breakdown.
- Volume during retest: After a breakout or breakdown, volume often decreases during the pullback (retest). Then it increases again as the price continues in the breakout/breakdown direction.
For example, if a stock breaks above Rs. 100 with very low volume, it might not have enough strength to continue higher. But if it breaks above Rs. 100 with volume much higher than average, it shows real buyer interest.
Always check volume before entering a trade based on a breakout or breakdown.
Breakout vs Breakdown vs False Breakout
It’s important to understand the difference between genuine moves and fake ones:
| Genuine Breakout | Genuine Breakdown | False Breakout/Breakdown |
| Price breaks above resistance with high volume. | Price breaks below support with high volume. | Price breaks out or down but quickly reverses. |
| Price continues in the breakout direction. | Price continues in the breakdown direction. | Price moves back into the trading range. |
| Retest holds (resistance becomes support). | Retest holds (support becomes resistance). | No successful retest; level fails. |
| Traders gain confidence to enter. | Traders gain confidence to enter. | Traders who entered early face losses. |
A false breakout (or false breakdown) happens when the price briefly moves beyond a level but then reverses back into the range. This is why confirmation—like waiting for a retest or checking volume—is so important.
Common Mistakes Beginners Make
Beginners often make these mistakes when trading breakouts and breakdowns:
- Entering too early: Buying or selling as soon as the price touches the level, without waiting for confirmation.
- Ignoring volume: Not checking whether volume supports the move. Low volume often leads to failed breakouts or breakdowns.
- Chasing the price: Entering after the price has already moved far from the breakout/breakdown level, increasing risk.
- Placing stop-loss incorrectly: A stop-loss should be placed below the breakout level (for long trades) or above the breakdown level (for short trades).
- Trading every breakout/breakdown: Not every move is worth trading. Focus on clear setups with strong levels and volume.
- Assuming 100% success: Even confirmed breakouts and breakdowns can fail. Always use proper risk management and never risk more than you can afford to lose.
How to Include Breakouts and Breakdowns in a Trading Plan
A trading plan helps you stay disciplined and avoid emotional decisions. Here’s how to include breakouts and breakdowns in your plan:
- Define your setup: Clearly state what qualifies as a valid breakout or breakdown (e.g., clear support/resistance, high volume, strong candlestick).
- Set entry rules: Decide when you will enter (e.g., after a strong close above resistance or below support, or after a successful retest).
- Determine stop-loss placement:
- For breakouts: Place stop-loss below the breakout level or retest low.
- For breakdowns: Place stop-loss above the breakdown level or retest high.
- Set profit targets: Use previous support/resistance levels, Fibonacci extensions, or risk-reward ratios (like 1:2 or 1:3) to set realistic targets.
- Manage risk: Never risk more than 1–2% of your capital on a single trade. This protects you from large losses.
- Review and improve: After each trade, review what worked and what didn’t. Adjust your plan based on real results.
Remember, a trading plan is personal. What works for one trader may not work for another. The key is consistency and discipline.
Final Thoughts
Understanding the difference between a breakout vs breakdown is essential for any trader learning technical analysis. A breakout shows bullish strength (price moving above resistance), while a breakdown shows bearish strength (price moving below support).
Both can lead to profitable trades, but both can also fail. That’s why confirmation—through volume, candlestick patterns, and retests—is so important. Never enter a trade based on a breakout or breakdown alone.
At Daily Dunia, we provide clear, educational content to help you learn trading concepts step by step. Follow us on Instagram for daily trading tips, chart breakdowns, and market insights.
Want more trading ideas and updates? Join our Bull & Bear Whispers WhatsApp Channel for regular content delivered straight to your phone.
Remember: Trading involves risk. Breakouts and breakdowns can fail, and no strategy guarantees success. Always do your own research and never invest money you cannot afford to lose.