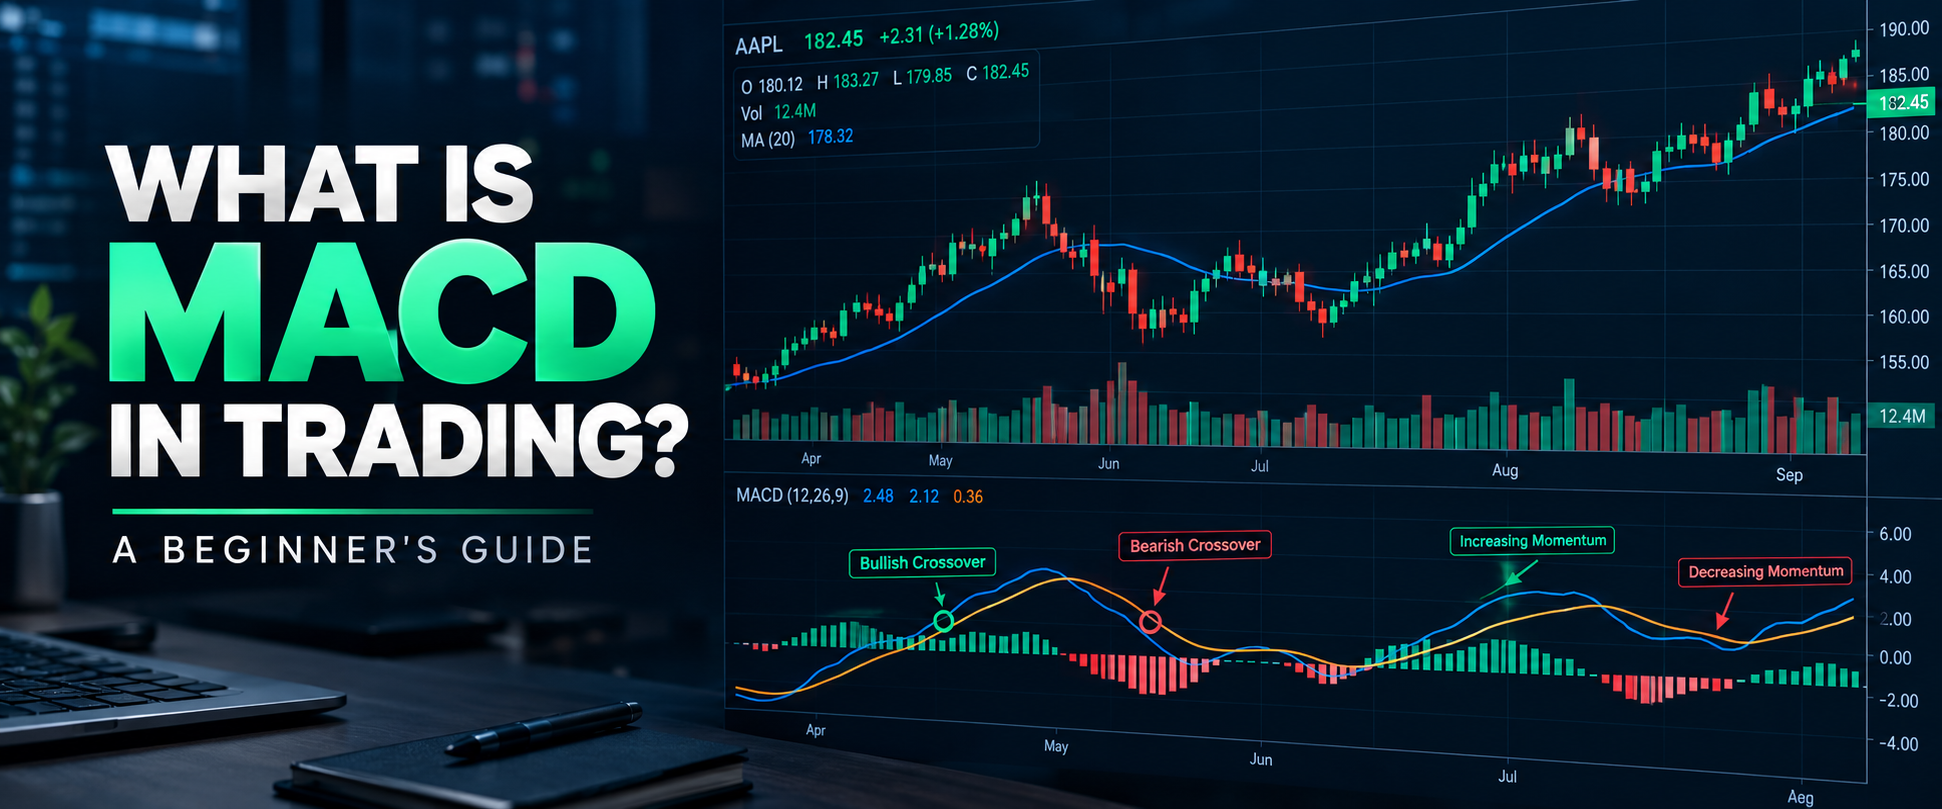
If you have started learning technical analysis, you have probably come across the word “MACD” more than once. It looks technical, but the idea behind it is actually simple once it’s explained in plain words. In this guide, Daily Dunia breaks down MACD in trading step by step, so beginners can understand exactly what it is and how it is used.
What Is MACD in Trading?
MACD stands for Moving Average Convergence Divergence. In simple words, it is a tool that helps traders understand the momentum and direction of a price trend. It does this by comparing two moving averages of a stock or asset’s price.
Think of MACD as a way to measure how fast and how strongly a price is moving in one direction. It does not predict the future. It simply studies past price movement and shows patterns that traders find useful when reading charts.
MACD is one of the most widely used indicators in technical analysis, alongside tools like RSI and moving averages. If you are new to this space, it may help to first read our guide on what is technical analysis in trading, since MACD is built on those same basic ideas.
How Does the MACD Indicator Work?
At its core, MACD is based on moving averages. A moving average smooths out price data over a period of time, making it easier to see the overall direction of a trend instead of getting distracted by small, everyday price changes.
MACD takes two moving averages a faster one and a slower one and studies the gap between them. When the gap widens, it usually means momentum is building. When the gap narrows, momentum may be slowing down. This is where the name comes from: the averages “converge” (come closer) and “diverge” (move apart) over time.
If you are still getting comfortable with this concept, our article on what is a moving average in trading explains the basics in more detail.
What Are the Main Parts of MACD?
MACD has three simple parts:
MACD Line: This is the main line, calculated from the difference between the fast and slow moving averages. It moves up and down based on changing momentum.
Signal Line: This is a smoothed version of the MACD line. Traders often compare the MACD line to the signal line to spot potential shifts in momentum.
MACD Histogram: This is a set of bars shown on the chart. It represents the distance between the MACD line and the signal line, making it easier to see momentum changes visually.
Together, these three parts make up the full MACD trading indicator.
What Does a MACD Crossover Mean?
A “crossover” happens when the MACD line and the signal line cross each other on the chart.
- A bullish crossover happens when the MACD line moves above the signal line. Traders often see this as a sign that upward momentum may be building.
- A bearish crossover happens when the MACD line moves below the signal line. This is often read as a sign that downward momentum may be increasing.
It is important to understand that a crossover is not a guaranteed buy or sell signal. Prices can be unpredictable, and crossovers can sometimes give false signals, especially in choppy or sideways markets. MACD works best when used alongside other tools, not on its own.
What Is the MACD Histogram?
The MACD histogram shows the gap between the MACD line and the signal line as a series of bars above and below a zero line.
When the bars grow taller, it can mean momentum is getting stronger. When the bars shrink, momentum may be weakening, even before an actual crossover appears on the chart. This is why many traders keep an eye on the histogram; it can sometimes hint at a shift before it fully shows up in the lines themselves.
How to Use MACD in Trading
Beginners can use MACD in a few basic ways:
- Studying momentum: Watching whether the MACD line is rising or falling helps gauge whether momentum is building or fading.
- Understanding trends: When MACD stays above zero for a while, it may suggest an ongoing uptrend. Below zero, it may suggest a downtrend.
- Looking at crossovers: Bullish and bearish crossovers can act as one input among many when studying a chart.
- Comparing MACD with price movement: Traders often check whether MACD movement lines up with actual price movement, or whether the two are telling different stories.
None of these methods work in isolation. MACD is best treated as one piece of a bigger puzzle when reading a chart.
MACD Divergence Explained
Divergence happens when the price of an asset and the MACD indicator move in different directions.
Bullish divergence: This happens when the price is making lower lows, but MACD is making higher lows. This can sometimes suggest that downward momentum is weakening, even though the price is still falling.
Bearish divergence: This happens when the price is making higher highs, but MACD is making lower highs. This can sometimes suggest that upward momentum is weakening, even though the price is still rising.
Divergence is a useful concept, but like crossovers, it is not a guaranteed signal. It simply gives traders another angle to study price behaviour.
By the way, if you follow Daily Dunia on Instagram, we regularly share simple visual breakdowns of concepts like this to make charts easier to understand at a glance.
MACD vs RSI: What’s the Difference?
MACD and RSI are both popular indicators, but they are used to study slightly different things.
MACD mainly focuses on the relationship between two moving averages to study trend direction and momentum. RSI, on the other hand, measures the speed and size of recent price changes to show whether an asset might be overbought or oversold.
Many traders use both together, since they highlight different aspects of price behaviour. If you would like a deeper look at the other side of this comparison, our guide on what is RSI in trading covers it in the same beginner-friendly style.
Common MACD Mistakes Beginners Make
- Using MACD alone: Relying on just one indicator can give an incomplete picture of the market.
- Treating every crossover as a guaranteed signal: Crossovers can be false, especially in sideways markets.
- Ignoring the overall trend: MACD signals can behave differently depending on whether the broader trend is up, down, or flat.
- Using too many indicators at once: Overloading a chart with tools can create confusing or conflicting signals.
- Expecting MACD to predict the market perfectly: No indicator, including MACD, can guarantee future price movement.
Avoiding these mistakes can help beginners use MACD in a more balanced and realistic way.
Should Beginners Use MACD?
MACD can be a helpful addition to a beginner’s technical analysis toolkit, as long as it is not treated as a standalone system for making decisions. It works well when combined with other tools, such as our guide on the best trading indicators for beginners, along with basic chart reading skills like the ones covered in how to read candlestick charts, and even simple context from what is trading volume.
According to Investopedia, MACD is best understood as a momentum-based tool that complements, rather than replaces, broader trend and price analysis. Learning to read it alongside other tools, rather than in isolation, is generally considered a more balanced approach.
Like any part of technical analysis, MACD takes practice. Beginners are encouraged to study historical charts, observe how MACD behaved during different market conditions, and build their understanding gradually rather than rushing to apply it to real trades.
Conclusion
MACD, or Moving Average Convergence Divergence, is a widely used momentum indicator built from two moving averages. Its three main parts the MACD line, the signal line, and the histogram help traders study trend direction and momentum shifts. Concepts like crossovers and divergence add extra layers of insight, but none of them offer guaranteed outcomes on their own.
For beginners, the key takeaway is that MACD works best as part of a broader approach to reading charts, not as a shortcut to easy decisions. Take time to learn it alongside other tools, practice on historical data, and build your understanding step by step.
This article is for educational purposes only and is not financial advice. Always do your own research before making any trading decisions.
Stay updated with more beginner-friendly guides on trading and finance join the Bull & Bear Whispers WhatsApp Channel for regular updates.