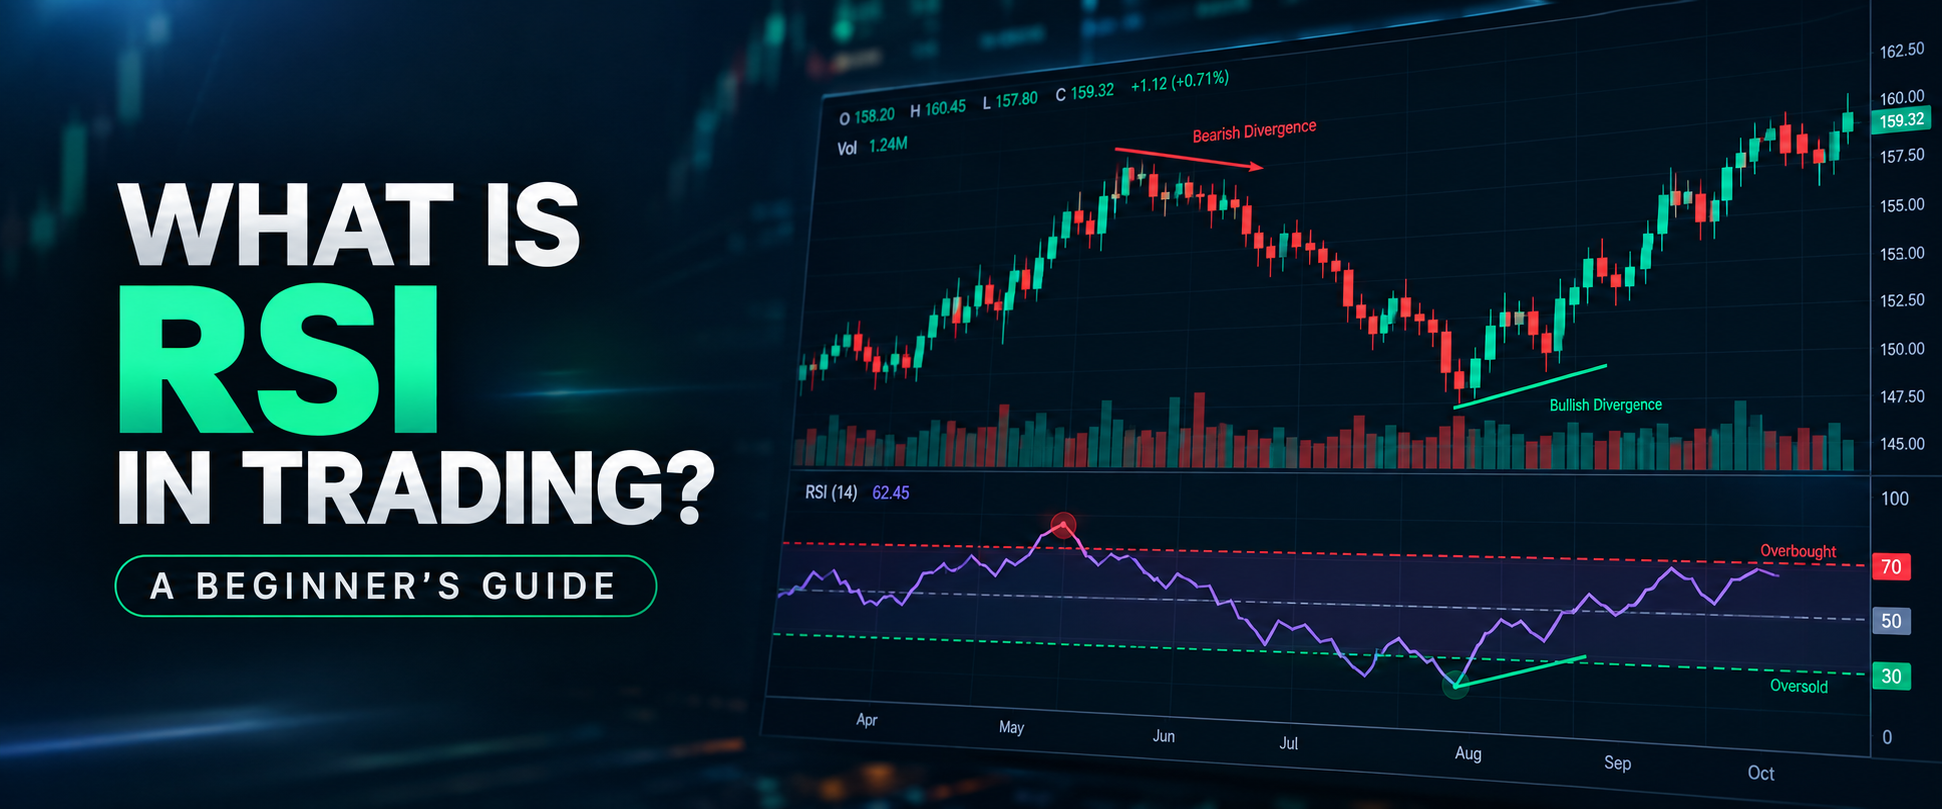
If you have ever looked at a trading chart and seen a wiggly line moving between 0 and 100 below the price, you have probably seen the RSI indicator. RSI in trading is one of the first tools most beginners come across, and for good reason — it is simple to read once you understand the basics.
In this guide, we will break down what RSI is, how it works, and how beginners can use it responsibly as part of a bigger technical analysis toolkit — not as a magic signal on its own.
What Is RSI in Trading?
RSI stands for Relative Strength Index. It is a momentum indicator, which means it measures the speed and strength of recent price movements rather than the price itself.
In simple words, RSI tells you how strong recent buying or selling activity has been. It does not predict the future. It simply reflects what has already happened in the market over a chosen time period, usually the last 14 candles or periods.
Traders use RSI to get a quick sense of momentum — whether buying pressure or selling pressure has been dominant recently. This is one reason RSI is often included in lists of essential indicators for beginners.
RSI was developed decades ago as a way to standardize momentum readings across any market — stocks, forex pairs, commodities, or indexes — so traders could compare momentum using the same 0–100 scale no matter what they were looking at. That’s part of why it has remained so popular with beginners: the reading looks and behaves the same way whether you’re studying a stock chart or a currency pair.
How Does the RSI Indicator Work?
The RSI indicator moves on a scale from 0 to 100. You do not need to memorize the formula behind it to use it well, but here is the simple idea:
- RSI compares the size of recent gains to the size of recent losses.
- If gains have been larger and more frequent, RSI moves higher, toward 100.
- If losses have been larger and more frequent, RSI moves lower, toward 0.
That’s really it. You don’t need to calculate anything by hand — your trading platform does the math and plots the line automatically. Your job as a trader is just to read what the line is telling you.
Most platforms default to a 14-period setting, meaning RSI looks at the last 14 candles on whatever timeframe you’re viewing, whether that’s a 1-hour chart or a daily chart. Beginners generally don’t need to change this default. Adjusting the period can make RSI more or less sensitive, but experimenting with settings is usually something to explore later, once you’re already comfortable reading the standard version.
What Do RSI Levels Mean?
Once RSI is plotted, traders watch a few common reference zones:
- Above 70: Momentum has been strongly upward recently.
- Around 50: Buying and selling pressure are roughly balanced.
- Below 30: Momentum has been strongly downward recently.
It’s important to understand that these are just commonly used reference points, not fixed rules. RSI can stay above 70 for a long time during a strong uptrend, and it can stay below 30 for a long time during a strong downtrend. A high or low RSI reading does not guarantee that the price is about to reverse.
What Is Overbought and Oversold in RSI?
You will often hear the terms “overbought” and “oversold” when people talk about RSI.
- Overbought simply means the price has risen quickly and momentum has been strong on the upside. It is usually associated with RSI above 70.
- Oversold means the price has fallen quickly and momentum has been strong on the downside. It is usually associated with RSI below 30.
Here’s the part beginners often get wrong: overbought does not automatically mean “sell now,” and oversold does not automatically mean “buy now.” These labels describe recent momentum, not a guaranteed turning point. Prices can remain overbought or oversold for extended periods, especially during strong trends. Treating these readings as automatic signals is one of the most common beginner mistakes.
How to Use RSI in Trading
Beginners can start building RSI skills gradually by focusing on a few habits:
- Understanding momentum: Get comfortable reading whether momentum is rising, falling, or flat, rather than jumping straight to buy/sell conclusions.
- Identifying possible changes in momentum: Watch how RSI behaves as it moves through the middle of its range — this can hint at shifting momentum.
- Comparing RSI with price movement: Look at the price chart and the RSI line side by side rather than in isolation.
- Using RSI with other tools: Many traders combine RSI with moving averages or candlestick patterns to build a fuller picture instead of relying on one indicator alone.
For more simple trading education and beginner-friendly tips, you can follow Daily Dunia on Instagram.
RSI Divergence Explained
Divergence is a concept some traders study once they are comfortable with the basics of RSI.
- Bullish divergence: This happens when the price makes a lower low, but RSI makes a higher low. It suggests that downward momentum may be weakening, even though price is still falling.
- Bearish divergence: This happens when the price makes a higher high, but RSI makes a lower high. It suggests that upward momentum may be weakening, even though price is still rising.
Divergence is an analysis concept used to study weakening momentum. It is not a guaranteed prediction of what price will do next, and it should be studied alongside other context, such as overall trend direction and support and resistance zones.
RSI vs Other Trading Indicators
RSI is a momentum indicator, which sets it apart from trend indicators like moving averages. A moving average smooths out price to show the overall direction of the market, while RSI focuses on the speed and strength of recent price changes.
Other indicators, such as those measuring trading volume, look at how much of an asset is being bought or sold, which is a different dimension from momentum. Most experienced traders don’t rely on a single indicator; they use a small combination that covers trend, momentum, and volume together.
Common RSI Mistakes Beginners Make
- Treating RSI above 70 as an automatic sell signal.
- Treating RSI below 30 as an automatic buy signal.
- Using RSI completely on its own, without other context.
- Ignoring the overall trend direction of the market.
- Loading charts with too many indicators at once, which creates confusion rather than clarity.
- Expecting RSI, or any indicator, to guarantee results.
Avoiding these habits early can save beginners a lot of frustration and encourage more thoughtful chart reading.
Should Beginners Use RSI?
RSI can be a useful learning tool for beginners because it is easy to read and widely used. However, it works best as one part of a broader technical analysis approach, rather than a standalone decision-making tool.
A helpful approach is to practice reading RSI alongside price action, trend direction, and other indicators on a demo account before applying any of it to real trades. According to Investopedia, RSI is best used as a supplementary tool within a broader trading strategy rather than in isolation. Patience and practice matter far more than finding one “perfect” indicator.
Conclusion
RSI in trading is a momentum indicator that moves between 0 and 100, helping traders get a quick read on recent buying and selling pressure. Levels above 70 and below 30 are commonly watched as overbought and oversold zones, but they are reference points, not guaranteed signals. Used thoughtfully, alongside trend analysis and other tools, RSI can be a helpful part of a beginner’s technical analysis toolkit just not the whole toolkit on its own.
Want more simple, beginner-friendly breakdowns like this one? Join the Daily Dunia WhatsApp Channel Bull & Bear Whispers for regular trading education, straight to your phone.