Technical analysis can feel overwhelming when you first start looking at trading charts full of lines, candles, and indicators. But some of the most useful tools in a trader’s toolkit are actually very simple to understand. One of them is the trendline. In this Daily Dunia guide, we break down what a trendline in trading is, how it works, and how beginners can use it to get a clearer picture of market direction.
What Is a Trendline in Trading?
A trendline in trading is a straight line drawn on a price chart to connect a series of price points, usually swing highs or swing lows. It is one of the simplest tools in technical analysis, yet it remains one of the most widely used.
The main purpose of a trendline is to help traders visualize the general direction in which an asset’s price is moving. Instead of trying to interpret dozens of individual candles, a trendline gives a quick visual summary: is the price generally climbing, falling, or moving sideways?
Traders use trendlines because they simplify a messy, noisy chart into something easier to read. This makes them a popular starting point for anyone learning how to analyze price charts.
How Do Trendlines Work?
To understand how trendlines work, it helps to first understand two basic chart concepts: swing highs and swing lows.
- A swing high is a peak in price, formed when the price rises and then pulls back.
- A swing low is a dip in price, formed when the price falls and then bounces back up.
Prices rarely move in a straight line. Instead, they move up and down in a series of these swings. When an asset’s price is generally moving upward, it tends to form a pattern of higher swing lows. When it’s generally moving downward, it tends to form a pattern of lower swing highs.
A trendline connects these swing points to highlight that underlying pattern. The more times the price reacts near the same line, the more traders tend to pay attention to it, since repeated reactions can suggest that other market participants are also watching that same level.
Types of Trendlines
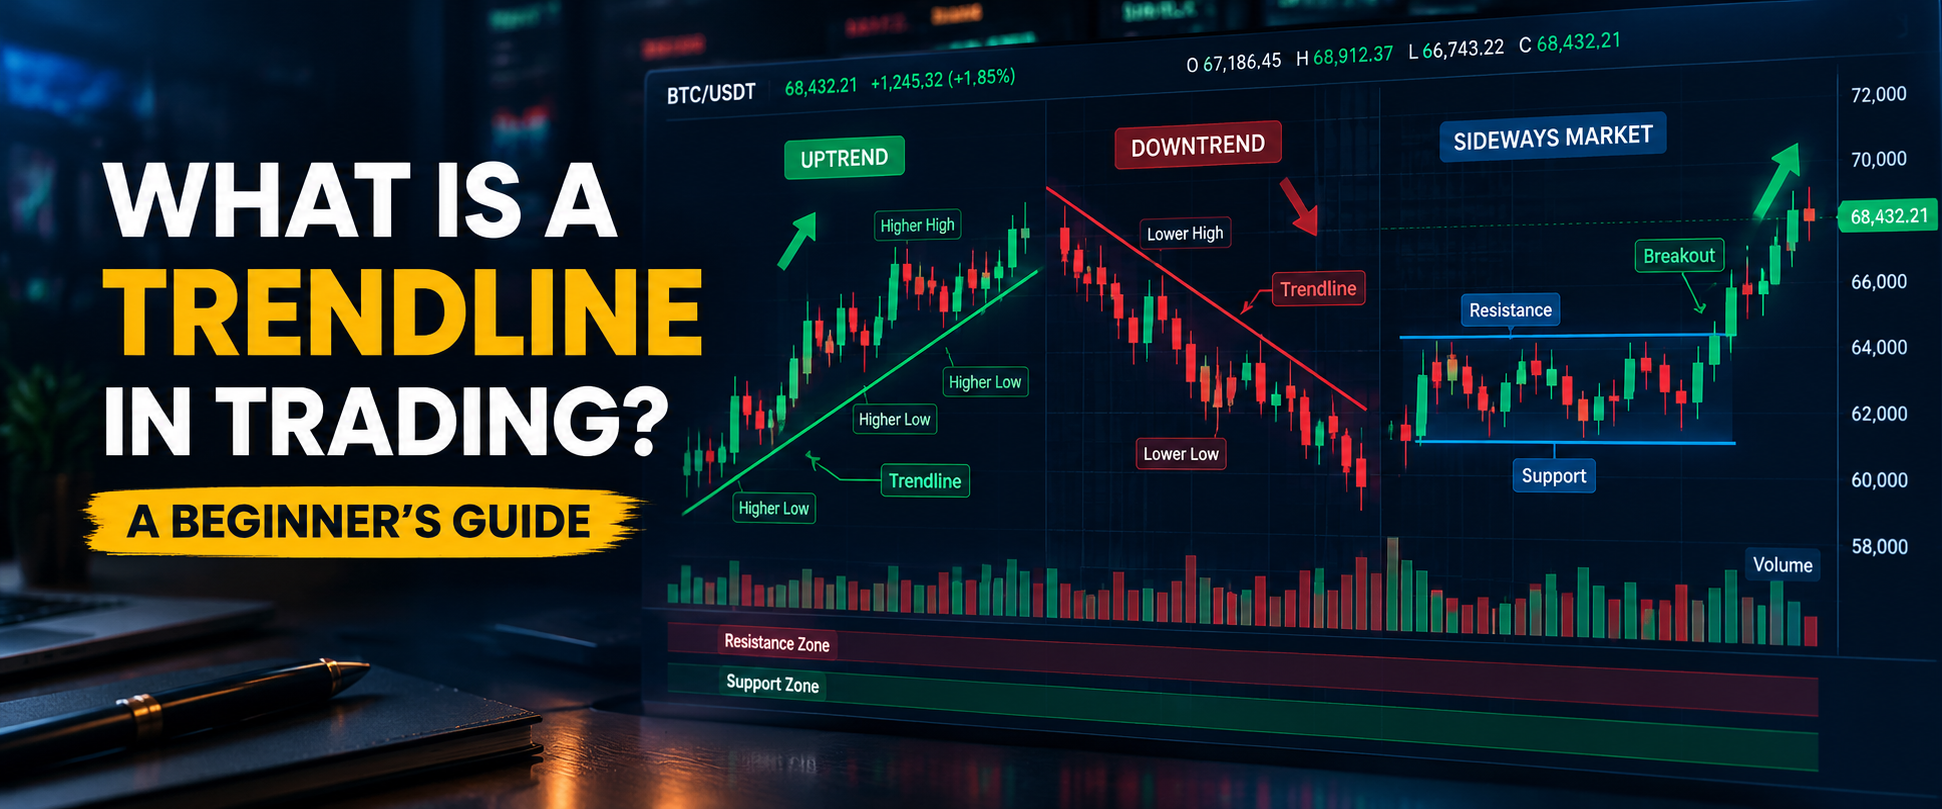
Uptrend Line
An uptrend line generally connects a series of rising swing lows. It is usually drawn below the price and slopes upward from left to right. Many traders see an uptrend line as a rough visual guide to the direction of an uptrend, with the price occasionally dipping down toward the line before continuing higher.
Downtrend Line
A downtrend line generally connects a series of falling swing highs. It is usually drawn above the price and slopes downward from left to right. It can help highlight a market where prices are broadly declining, with occasional bounces up toward the line.
Sideways or Range-Bound Markets
Not every market trends. Sometimes price moves sideways for an extended period, bouncing between a relatively steady upper and lower range without a clear upward or downward direction. In these conditions, a single sloped trendline may not be as useful, and traders often look at horizontal support and resistance levels instead.
How to Draw a Trendline
Drawing a trendline is straightforward once you understand the basic steps:
- Identify the overall market direction. Look at the chart broadly to see whether price appears to be trending up, trending down, or moving sideways.
- Find important swing highs or swing lows. For an uptrend, look for rising lows. For a downtrend, look for falling highs.
- Connect the relevant points. Draw a straight line linking at least two swing points that follow the same general direction.
- Extend the line to observe future price behaviour. This can help you see how price reacts if it approaches the line again later.
- Look for repeated reactions. A trendline that price has touched or bounced from multiple times is often considered more significant than one based on a single touch.
- Avoid forcing the line to fit the chart. If you have to stretch the line through the middle of candles to make it “work,” it may not be a meaningful trendline.
This process of learning how to draw a trendline takes some practice, and it’s normal for beginners to draw several versions before finding one that reflects the chart naturally.
Trendline Support and Resistance
Trendlines are closely linked to the idea of support and resistance.
- During an uptrend, the trendline can act as a form of support, a level where price has tended to stop falling and turn back upward.
- During a downtrend, the trendline can act as a form of resistance, a level where price has tended to stop rising and turn back downward.
Traders often watch how price behaves when it approaches a trendline, since a bounce may suggest the trend is continuing. However, it’s important to remember that trendlines are guides rather than exact, guaranteed levels. Price can move slightly beyond a trendline and still remain within the broader trend.
What Does a Trendline Break Mean?
A trendline break happens when price moves through a trendline instead of reacting to it as it has in the past. Some traders view this as a sign that the previous trend’s momentum may be weakening.
However, not every break is meaningful. Price can briefly poke through a trendline and then move back in the original direction this is often called a false break. A more significant shift usually involves the price closing clearly beyond the trendline, sometimes with other supporting signals.
This is why confirmation matters. Many traders wait for additional evidence, such as a candle close beyond the line, increased trading volume, or agreement from another indicator, before treating a trendline break as a meaningful change. A trendline break should never be treated as a guaranteed buy or sell signal on its own.
How Traders Use Trendlines in Technical Analysis
Trendlines serve several practical purposes in technical analysis:
- Identifying market direction at a glance
- Finding potential support or resistance zones
- Watching for possible breakouts that may signal a shift in trend
- Understanding price structure, including how highs and lows are forming over time
- Combining with other indicators to build a broader view of the market
It’s worth emphasizing that trendlines are just one part of technical analysis, not a complete trading system on their own. Most experienced traders use them alongside other tools rather than in isolation.
Common Trendline Mistakes Beginners Make
New traders often run into a few recurring issues when working with trendlines:
- Connecting random price points that don’t reflect a genuine pattern of swing highs or lows.
- Forcing a trendline to fit the chart by ignoring candles that clearly cross through it.
- Treating every touch as a reversal, when in reality price can touch a trendline multiple times without reversing significantly.
- Entering immediately after a breakout without waiting for confirmation, which can lead to reacting to false breaks.
- Ignoring the broader trend and focusing only on a short-term line that contradicts the bigger picture.
- Using trendlines without confirmation from other tools or price action.
- Drawing too many lines on one chart, which can create confusion rather than clarity.
Being aware of these mistakes can help beginners use trendlines more thoughtfully.
Are Trendlines Reliable?
Trendlines are useful, but they are not perfectly reliable, and it’s important to have realistic expectations.
Markets can be volatile, and price can break a trendline briefly before reversing, creating false breakouts. Trendlines also look different depending on the timeframe you’re viewing, so a line that appears solid on a daily chart might look very different on an hourly chart. Additionally, choosing which swing points to connect involves some subjectivity, meaning two traders might draw slightly different trendlines on the same chart. Market conditions can also change quickly, which may make a previously reliable trendline less relevant going forward.
None of this means trendlines are not worth learning. It simply means they work best as one input among several, not as a standalone, foolproof system.
Trendlines vs Other Technical Analysis Tools
Trendlines are often used alongside other tools to build a more complete picture of the market:
- Moving averages can help confirm the general direction suggested by a trendline. Readers who want a deeper look can check out our guide on what a moving average in trading is.
- RSI can help show whether an asset is potentially overbought or oversold near a trendline, as explained in our RSI in trading guide.
- MACD can help confirm shifts in momentum around a trendline break, covered in our MACD in trading article.
- Support and resistance levels often work hand in hand with trendlines, since a trendline is essentially a dynamic, sloped version of these zones. See our guide on what support and resistance is.
- Candlestick patterns near a trendline can offer additional context about potential reversals or continuations. Our guide on how to read candlestick charts covers this in more detail.
- Trading volume can help confirm whether a trendline break is backed by strong participation. Learn more in our article on what trading volume is.
Using trendlines together with these tools tends to give a more balanced view than relying on a trendline alone.
Should Beginners Use Trendlines?
Yes, trendlines are a good starting point for beginners because they are relatively easy to understand and visually intuitive. They can help new traders start recognizing price structure, direction, and potential turning points on a chart.
That said, beginners should practice drawing trendlines on historical charts before applying them to real trades. This kind of practice builds familiarity with what a “clean” trendline looks like versus a forced one. Trendlines should also never be treated as guaranteed trading signals, but rather as one piece of a broader analysis process.
Conclusion
A trendline in trading is a simple but valuable tool that helps visualize the general direction of price movement by connecting swing highs or swing lows. Understanding uptrend lines, downtrend lines, trendline support and resistance, and what a trendline break may indicate gives beginners a solid foundation for reading charts.
As with any technical analysis tool, trendlines work best when combined with other indicators and used with realistic expectations about their limitations. At Daily Dunia, our goal is to keep breaking down concepts like this into simple, practical explanations so beginners can build their trading knowledge step by step.