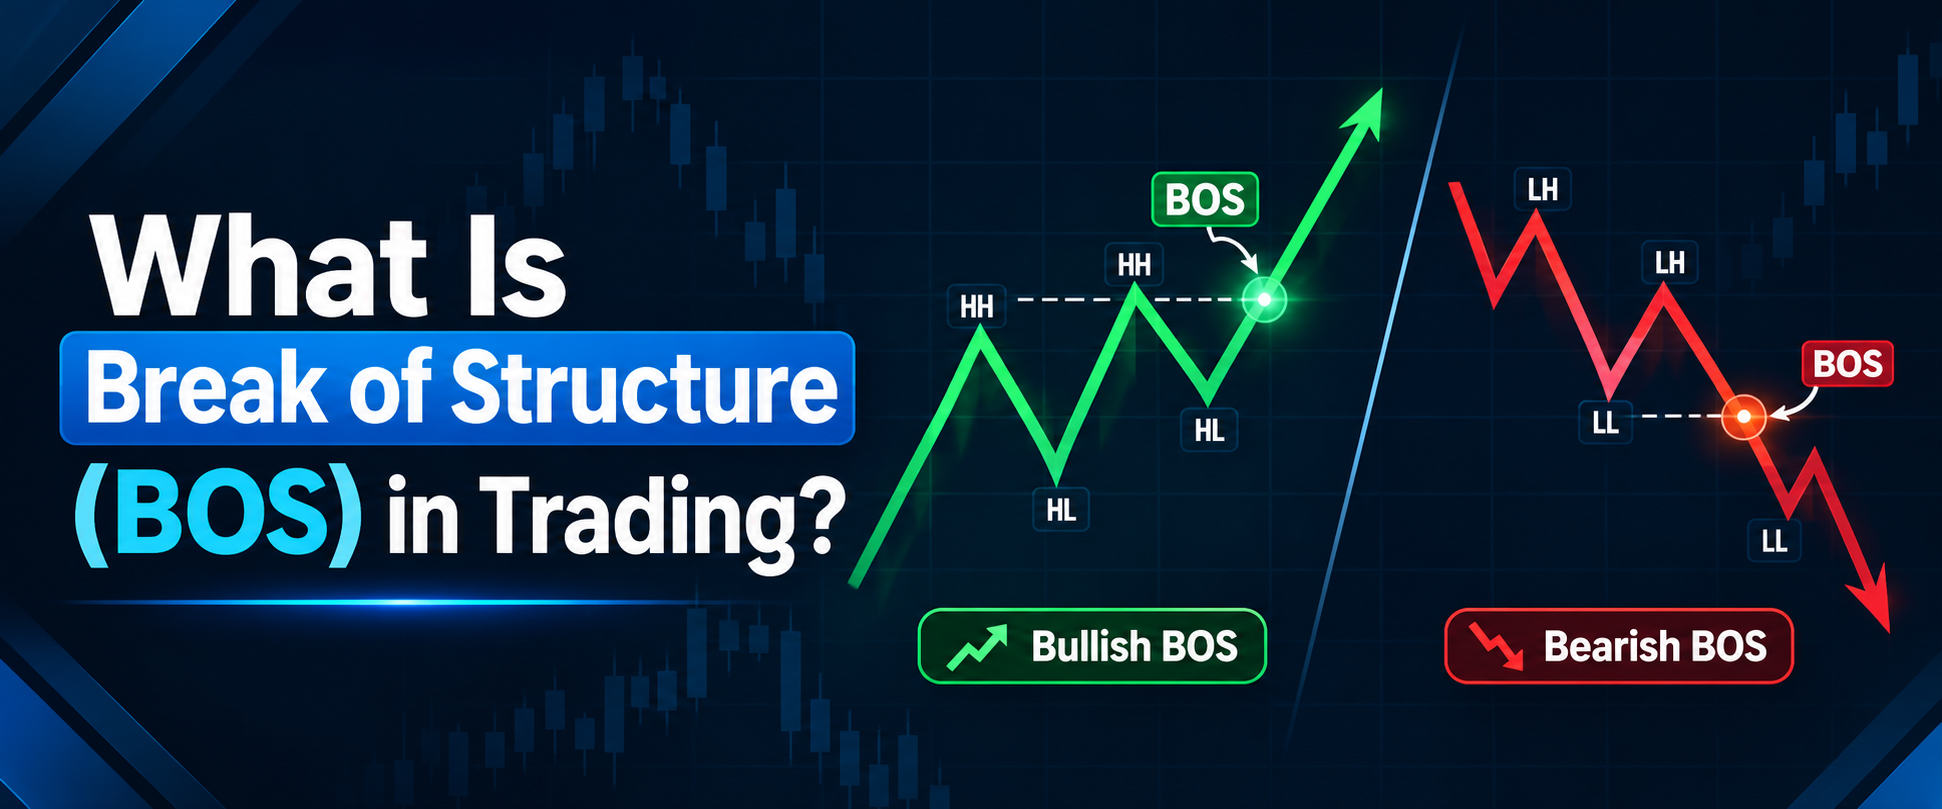
Reading market structure is one of the first skills every price action trader learns. A break of structure, or BOS, is a simple signal that shows when a trend may be continuing. If you have seen “BOS” marked on charts and wondered what is break of structure in trading, this Daily Dunia guide explains what a break of structure is in trading, how to spot bullish and bearish BOS on a chart, and how traders use it to follow the trend.
We will also compare BOS with CHoCH and normal breakouts, and look honestly at its limits.
What Is Break of Structure in Trading?
A break of structure (BOS) happens when price moves beyond the most recent swing point in the direction of the current trend, suggesting the trend is continuing. In an uptrend, that means breaking above the last swing high. In a downtrend, it means breaking below the last swing low.
That is the basic break of structure meaning. Each new BOS tells you the trend has made another step in the same direction.
The term is widely used in Smart Money Concepts (SMC) and the ICT trading strategy, where traders use it to confirm trend direction before looking for entries.
Understanding Market Structure First
Market structure in trading is the pattern of swing highs and swing lows that shows which way price is trending.
A swing high is a peak where price stops rising and turns down. A swing low is a dip where price stops falling and turns up. Connect these points, and the trend becomes easy to see.
- Uptrend: price makes higher highs and higher lows. Each peak and each dip is above the last one.
- Downtrend: price makes lower highs and lower lows. Each peak and each dip is below the last one.
- Range: price moves sideways without clear higher or lower swings.
Learning to read higher highs and lower lows is the foundation of spotting a break of structure. Without a clear trend, a BOS has little meaning.
Types of Break of Structure
There are two types of break of structure: bullish and bearish.
Bullish Break of Structure
A bullish break of structure happens when price breaks above the last swing high in an uptrend. It suggests buyers are still in control.
Hypothetical example: a stock rises from $100 to a swing high of $108. It then pulls back to $104, forming a higher low. Next, price rallies and closes at $109.50, above the $108 swing high. That close marks a bullish BOS.
Bearish Break of Structure
A bearish break of structure happens when price breaks below the last swing low in a downtrend. It suggests sellers are still in control.
Hypothetical example: a stock falls from $60 to a swing low of $54. It then bounces to $57, forming a lower high. Next, price drops and closes at $52.80, below the $54 swing low. That close marks a bearish BOS.
| Feature | Bullish BOS | Bearish BOS |
|---|---|---|
| Trend | Uptrend | Downtrend |
| Level Broken | The last swing high | The last swing low |
| What It Suggests | The uptrend may continue | The downtrend may continue |
| What Traders Look For | A pullback to buy | A pullback to sell |
How to Identify a Break of Structure on a Chart
You can identify a break of structure by marking the latest swing point in the trend and watching for price to move beyond it. Here is how to identify break of structure step by step:
- Find the current trend direction. Check whether price is making higher highs and higher lows, or lower highs and lower lows.
- Mark the most recent swing point. In an uptrend, mark the last swing high. In a downtrend, mark the last swing low.
- Wait for price to break it. Watch for price to move beyond that marked level in the direction of the trend.
- Check the candle close. Many traders only count a BOS when a candle body closes beyond the level, not just a wick.
- Update your structure. After the break, mark the new swing points and repeat the process.
Higher time frames, such as the 4-hour or daily chart, usually show cleaner structure. Small time frames produce many minor breaks that can be misleading.
How Traders Use Break of Structure
Traders use break of structure mainly to confirm the trend and then plan entries on the next pullback. BOS trading usually follows these steps:
- Confirm the trend: a BOS tells you which direction to favor.
- Wait for a pullback: instead of chasing the break, many traders wait for price to return to a zone, such as an order block or fair value gap.
- Look for confirmation: a rejection candle in that zone can support an entry.
- Set the stop and target: place the stop-loss beyond the last swing low or high, and plan a target in advance.
Here is a hypothetical example of how to trade break of structure using the bullish case above. After the BOS above $108, price pulls back to $106. You enter at $106 with a stop at $103.80, just below the $104 higher low. That is $2.20 of risk. A target of $110.40 gives $4.40 of reward, a 1:2 risk-reward ratio.
BOS vs CHoCH: What Is the Difference?
The difference is direction. A BOS breaks a swing point in the same direction as the trend, while a change of character (CHoCH) breaks a swing point against the trend, warning that the trend may be reversing.
For example, in an uptrend, breaking above a swing high is a BOS. Breaking below the last higher low is a CHoCH.
| Feature | BOS | CHoCH |
|---|---|---|
| Direction | With the trend | Against the trend |
| Level Broken | Swing high in an uptrend, swing low in a downtrend | Higher low in an uptrend, lower high in a downtrend |
| What It Suggests | Trend continuation | Possible trend reversal |
| Common Use | Joining the existing trend | Watching for a new trend |
Break of Structure vs Breakout
A break of structure and a breakout look similar, but they are read differently. A BOS is judged within the context of a trend and its swing points. A breakout usually refers to price moving through a range or a key level, such as support and resistance, whatever the trend.
In the break of structure vs breakout comparison, every BOS is a kind of breakout, but not every breakout is a BOS.
Limitations of Break of Structure
Break of structure is a useful way to read trends, but it is not a guaranteed signal. Its main limitations include:
- Swing points are subjective: traders may mark different highs and lows on the same chart.
- False breaks happen: price can break a level and then quickly reverse.
- Noise on small time frames: 1-minute and 5-minute charts show many minor breaks that mean little.
- Hindsight bias: BOS looks obvious on past charts but is harder to judge in real time.
Before using BOS with real money, backtest it on historical charts and practice on a demo account.
Frequently Asked Questions
What is break of structure in simple words?
A break of structure is when price moves past its last swing high in an uptrend, or its last swing low in a downtrend. It suggests the trend is likely continuing.
What is the difference between BOS and CHoCH?
A BOS breaks structure in the direction of the trend and signals continuation. A CHoCH breaks structure against the trend and warns of a possible reversal.
Does a wick break count as a BOS?
Traders disagree on this. Many prefer a candle body close beyond the level because wick breaks can be false moves that quickly reverse.
What time frame is best for BOS?
Higher time frames, such as the 4-hour and daily charts, usually show clearer structure. Many traders confirm the trend there and use lower time frames for entries.
Final Thoughts
So, what is break of structure in trading? It is the moment price breaks its last swing point in the direction of the trend, suggesting the trend is continuing. BOS helps you read market structure and avoid trading against the trend, but swing points are subjective and false breaks happen. Always combine BOS with confirmation, a clear stop-loss and sound risk management, and practice on a demo account first.
To keep learning Smart Money Concepts and price action in simple words, explore more beginner guides on Daily Dunia.