A trend continuation in trading happens when the price of an asset keeps moving in the same direction after a short pause or pullback. Instead of reversing, the trend continues — either upward in a bull market or downward in a bear market.
For beginners, learning how to identify trend continuation can help avoid entering trades too early or exiting too soon. In this article, we’ll explain what trend continuation means, how it differs from a trend reversal, and what signals traders watch to confirm a strong trend in trading.
What Is Trend Continuation in Trading?
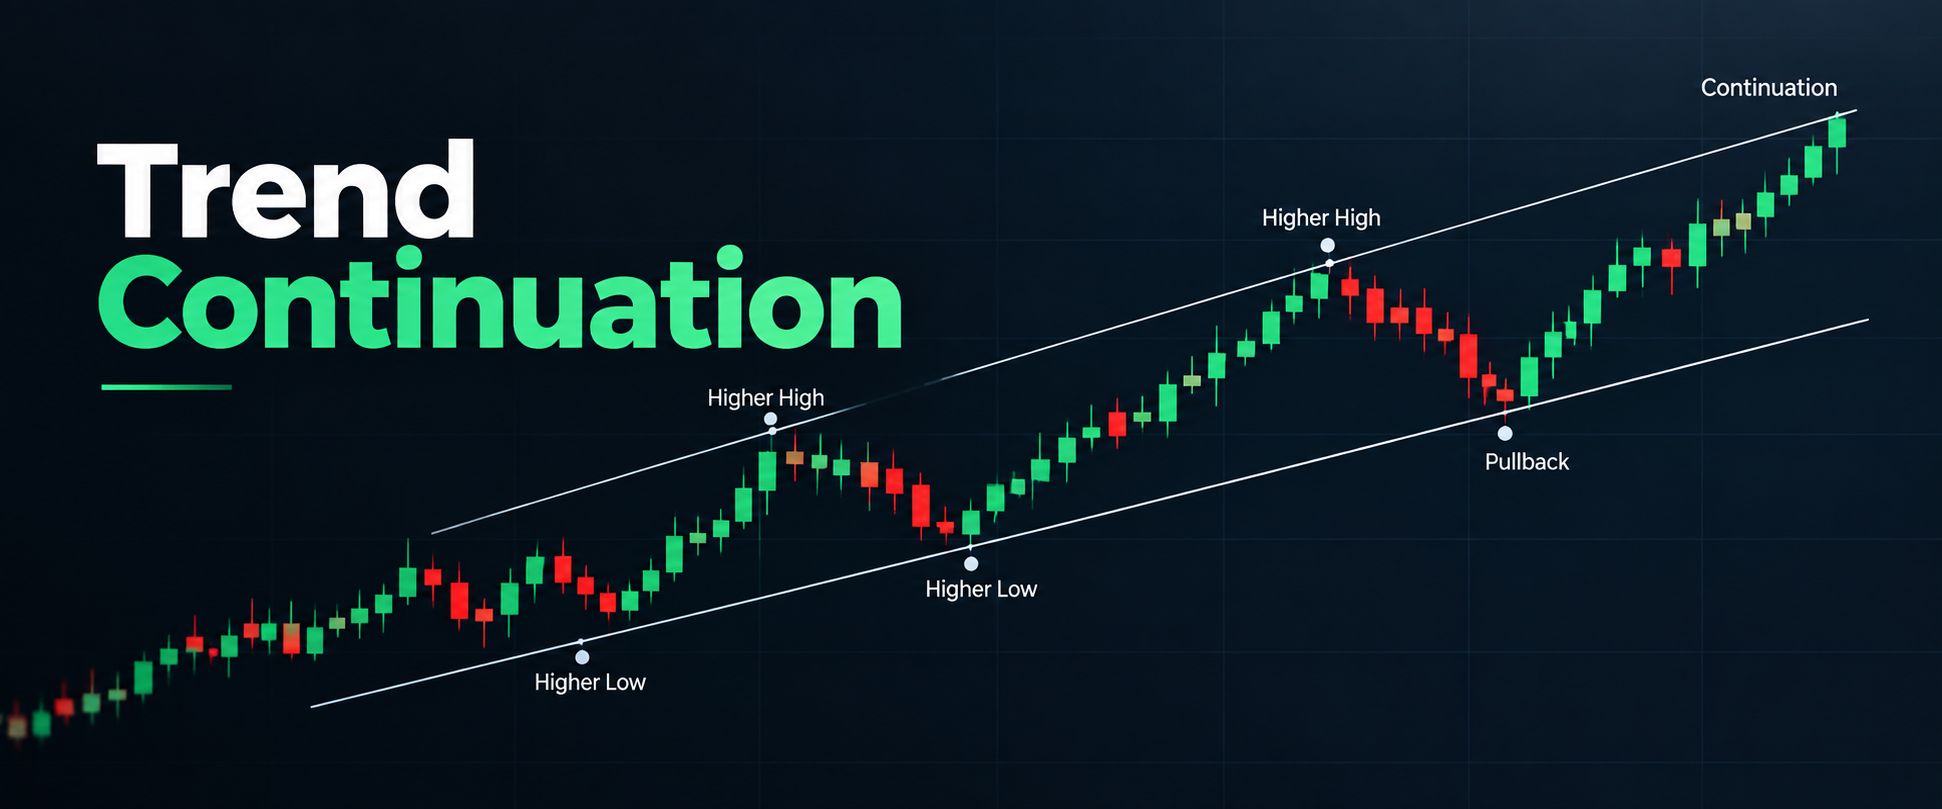
Trend continuation simply means the price trend is still going in the same direction. If the market was in an uptrend, it keeps making higher highs and higher lows. In a downtrend, it keeps making lower highs and lower lows.
Think of it like a car driving uphill. Sometimes it slows down for a moment (a pullback), but then it continues climbing. That’s a trend continuation in trading.
Traders look for specific patterns and signals to confirm that the trend is likely to continue instead of reversing.
Trend Continuation vs Trend Reversal
It’s important to understand the difference between trend continuation and trend reversal:
- Trend continuation: The price pauses briefly, then continues in the original direction.
- Trend reversal: The price changes direction completely — an uptrend becomes a downtrend, or vice versa.
For example, if Bitcoin was rising from $60,000 to $70,000, then dipped to $68,000 before rising again to $72,000, that’s continuation. But if it dropped from $70,000 all the way to $55,000 and kept falling, that’s a reversal.
Knowing the difference helps traders decide whether to hold their position or exit.
How Does a Trend Continue?
A price trend continues when buyers (in an uptrend) or sellers (in a downtrend) remain in control. Even after a small pullback, the dominant group steps back in and pushes the price further in the original direction.
Several factors support trend continuation:
- Strong market sentiment (bullish or bearish)
- High trading volume in the direction of the trend
- Key support or resistance levels holding firm
- Positive news or economic data supporting the trend
When these factors align, the likelihood of trend continuation in trading increases.
How to Identify Trend Continuation
Here are common ways traders spot trend continuation signals:
1. Higher Highs and Higher Lows (Uptrend)
In an uptrend, each new peak is higher than the last, and each pullback stops at a higher low. This structure shows buyers are still in control.
2. Lower Highs and Lower Lows (Downtrend)
In a downtrend, each new low is lower than the previous one, and each bounce fails to reach the prior high. This shows sellers dominate.
3. Breakout Above Resistance (or Below Support)
When price breaks through a key level and keeps moving in that direction, it often signals continuation. For more on this, see our article on breakouts in trading.
4. Pullbacks That Hold Key Levels
A small dip that bounces off a support level (in an uptrend) or resistance level (in a downtrend) often leads to trend continuation. Learn more in our guide on pullbacks in trading.
Support and Resistance in Trend Continuation
Support and resistance levels play a big role in confirming trend continuation.
- In an uptrend, old resistance often becomes new support. When price bounces off this new support, it signals continuation.
- In a downtrend, old support often becomes new resistance. When price rejects this level, the downtrend is likely to continue.
For a deeper explanation, check our article on support and resistance in trading.
Continuation Patterns Traders Watch
Traders use chart patterns to spot continuation patterns in trading. Common ones include:
1. Bull Flag (Uptrend)
A sharp rise followed by a small downward-sloping channel. When price breaks above the channel, the uptrend continues.
2. Bear Flag (Downtrend)
A sharp drop followed by a small upward-sloping channel. When price breaks below the channel, the downtrend continues.
3. Triangle Patterns
Symmetrical, ascending, or descending triangles often act as continuation patterns when price breaks out in the original trend direction.
These patterns don’t guarantee success, but they help traders plan entries and exits.
How Trading Volume Can Confirm a Trend
Trading volume is one of the most reliable tools to confirm trend continuation in trading.
- In an uptrend, volume should increase on up-days and decrease on pullbacks.
- In a downtrend, volume should increase on down-days and decrease on bounces.
If volume drops significantly during a breakout or continuation move, it may signal weakness. For more details, read our guide on trading volume.
Using Indicators to Study Trend Continuation
Many traders use technical indicators to study trend continuation. Common ones include:
1. Moving Averages
Price staying above a rising 50-day or 200-day moving average suggests uptrend continuation. Price staying below a falling moving average suggests downtrend continuation.
2. RSI (Relative Strength Index)
In a strong uptrend, RSI often stays between 40–80. In a strong downtrend, it stays between 20–60. Extreme readings (above 70 or below 30) can signal overbought or oversold conditions — but not always reversal.
3. MACD (Moving Average Convergence Divergence)
When the MACD line stays above the signal line in an uptrend (or below in a downtrend), it supports trend continuation.
Remember: indicators are tools, not crystal balls. They work best when combined with price action and volume. For a beginner-friendly intro, see our article on what is technical analysis in trading.
Common Mistakes Beginners Make
Here are frequent errors traders make when trying to trade trend continuation:
- Entering too early: Jumping in before the pullback is complete.
- Ignoring volume: Not checking if volume supports the move.
- Confusing reversal with continuation: Misreading a small pullback as a full trend change.
- Overusing indicators: Relying only on indicators without looking at price structure.
- No stop-loss: Not protecting capital if the trend suddenly reverses.
Avoiding these mistakes improves your chances of riding a strong trend in trading.
How to Include Trend Continuation in a Trading Plan
A solid trading plan includes rules for spotting and trading trend continuation:
- Define the trend: Use higher highs/lows or moving averages.
- Wait for pullback: Let price come to support (uptrend) or resistance (downtrend).
- Confirm with volume: Ensure volume supports the continuation move.
- Set entry and stop-loss: Enter on breakout of pullback; place stop below recent low (uptrend) or above recent high (downtrend).
- Take profit logically: Target previous swing high/low or use a risk-reward ratio (e.g., 1:2 or 1:3).
Always remember: technical analysis helps assess probabilities, not guarantees. No signal ensures future price movement.
Final Thoughts
Trend continuation in trading is a core concept for anyone learning technical analysis. By understanding how trends continue, recognizing key patterns, and using volume and indicators wisely, traders can improve their timing and confidence.
At Daily Dunia, we break down complex trading concepts into simple, practical lessons. Follow us on Instagram for daily tips and market insights.
Join our WhatsApp Channel for free trading updates, beginner-friendly content, and simple lessons that support your learning journey.